Key Information about 2024: An Evolving Benchmark
Each year, the GRESB Standards evolve to better reflect the needs and priorities of the real assets investment community. This work is driven by investors and other industry stakeholders who serve as volunteer leaders of the non-profit GRESB Foundation.

Infrastructure Standards changes and key questions to ask in 2024
The GRESB Infrastructure Standards were updated in 2024; however, there was no significant change in scoring. Investors and managers are encouraged to engage using year-over-year changes in top-line scores or any of the more detailed information found in the Benchmark Report. Learn more about:
- Changes to the Infrastructure Standards and recommended questions for engagement
- How to read Infrastructure Benchmark Reports
- Frequently asked questions for infrastructure investors

2024 Real Estate Standards
The GRESB Foundation made significant updates to the 2024 Real Estate Standards. The Foundation prioritized changes to “raise the bar” for sustainability and to provide more granular benchmarks for entity and asset performance. The result is a more rigorous and specific benchmark aligned with key stakeholder priorities. Investors need to be aware of these changes when reviewing results and engaging with managers.
- Motivation: Foundation members believe that GRESB Real Estate standards need to evolve to increase expectations for sustainability, emphasize measured, asset-level performance, and apply more targeted, spatially granular benchmarks.
- Impact: These adjustments mean that evaluating year-over-year changes in total GRESB Real Estate scores requires considering both changes in entity performance and changes in the assessment. It also means that historic trends in industry-wide year-over-year improvement have been reduced, and it requires more action to keep up with raising expectations.
- Recommendation: Investors and managers are encouraged to go deeper into the 2024 Real Estate results and engage in information that goes beyond top-line scores.
Learn more about:
- Changes to the Real Estate Standard and recommendations for investors
- Frequently asked questions for real estate investors

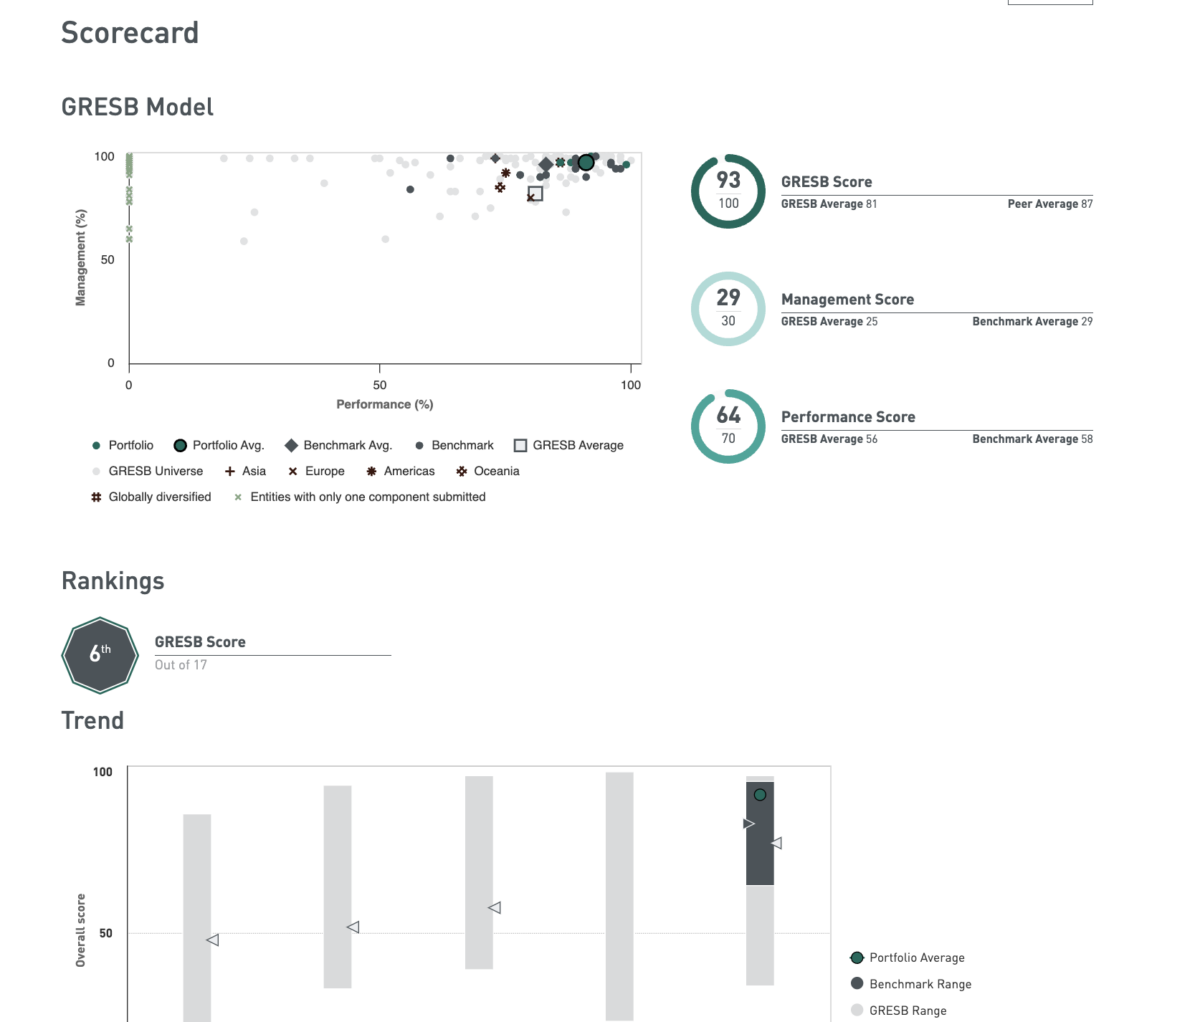
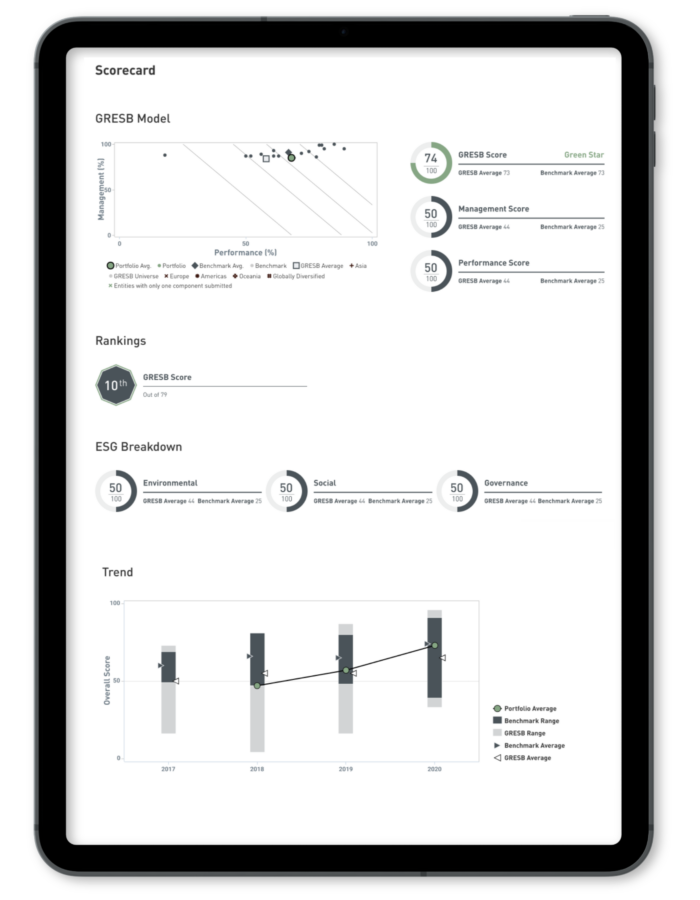
How to read the Real Estate Benchmark Report in 2024
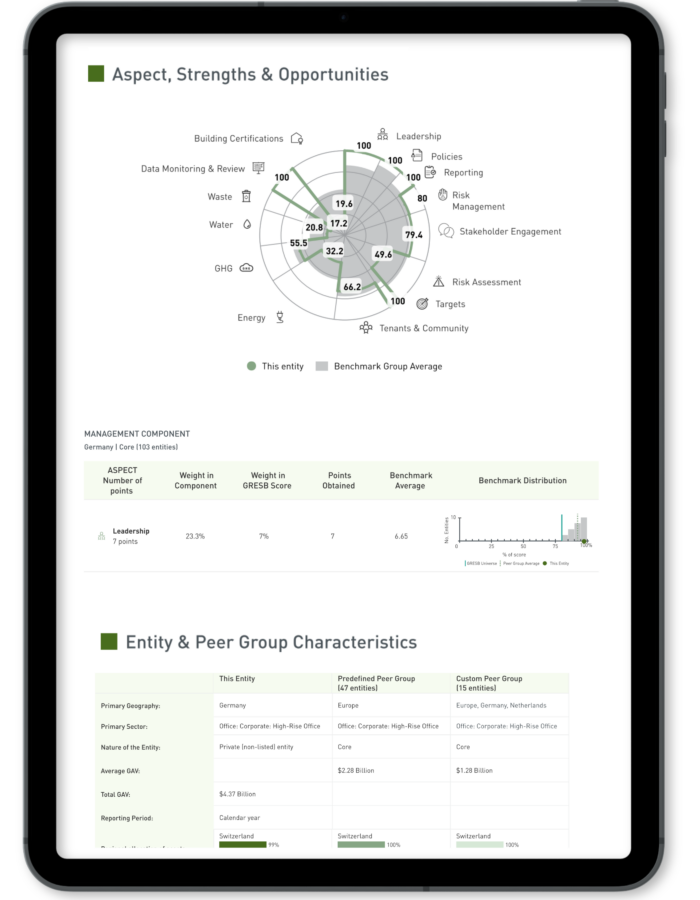
A GRESB Real Estate Benchmark Report provides a lot of information about sustainability practices and performance. In 2024, it is especially important to go beyond top-line scores and engage on specific issues and metrics. GRESB Star Ratings normalize for score changes and provide relatively stable measures of market position within a segment. Aspect Scores and benchmarks provide insights about specific issues, such as stakeholder engagement and risk management. Performance Indicators provide stable, comparable information about data coverage, as well as energy, emissions, water, and waste intensities. This information helps investors and managers identify relative strengths and weaknesses and prioritize action aligned with business strategies. Engaging around this information is likely to be more constructive than focusing on year-over-year score changes.
Frequently asked questions
Below are answers to common questions investors have regarding the 2024 benchmarks, for both real estate and infrastructure.
Real Estate FAQ 2024
-
Please reach out to your account manager at GRESB to manage users within your Investor Membership.
-
This depends on the type of subscription you have. When signing up to the GRESB Investor Membership, you may purchase the following subscriptions:
- Real Estate | Listed
- Real Estate | Non-listed
- Infrastructure | Listed
- Infrastructure | Non-listed
With a listed subscription, you will, by default, have access to all Benchmark Reports and other reports of listed entities (such as Transition Risk Report, SFDR Report, TCFD Report, if the entities have purchased those).
As for non-listed subscriptions, you can request access to participants’ Benchmark Reports in the Portal. Once the entities grant access, you will be able to access the reports. Note that access for different reports must be requested individually, meaning that having access to an entity’s Benchmark Report does not automatically mean you also have access to their Transition Risk Report. You can request access next to reports that are shown ‘Access Requestable’.
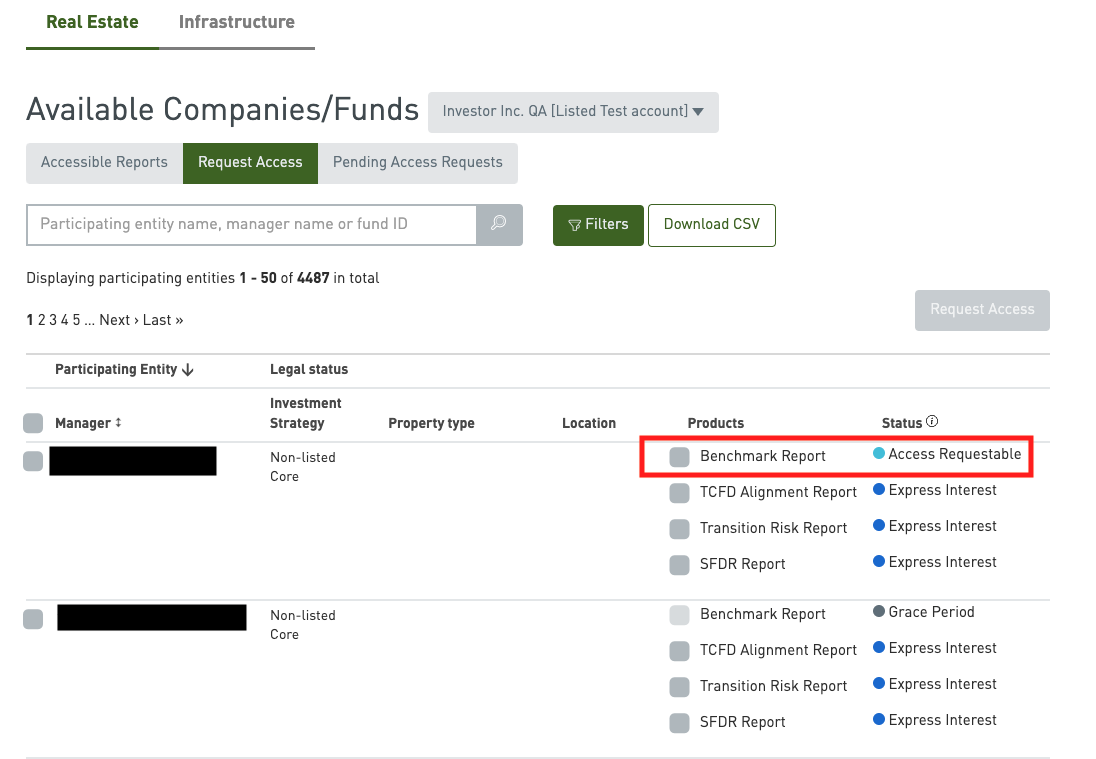
-
Express interest means the entity in question has not purchased the specific report yet. With your expression of interest, they will be notified and can consider whether to purchase the product. After the purchase and release of the reports, they can then decide whether to share it with individual Investor Members. You can express your interest under the ‘Request Access’ tab.
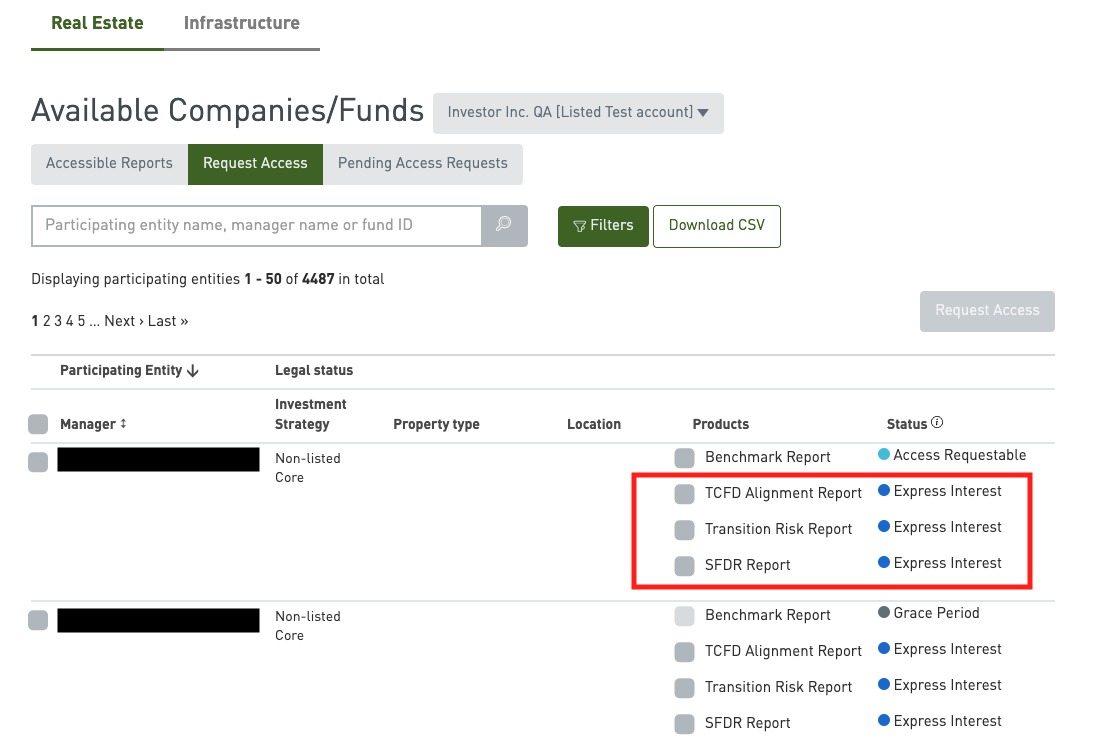
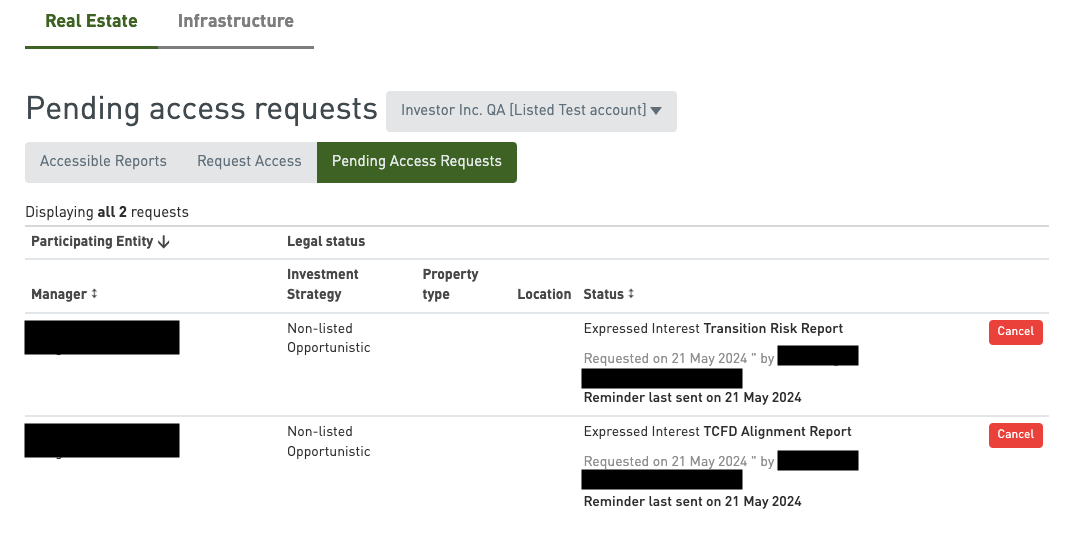
You can always cancel your request under tab ‘Pending Access Requests’ as well.
-
The entities will be notified by email once a request has been made. Our system generates a reminder email every two weeks in case the entity has neither granted nor declined access on the Portal.
If the request is time sensitive, we would suggest reaching out to the entity via your own channels and asking them to respond to your request on the GRESB Portal.
-
First-year participants can opt out of allowing GRESB Investors Members, or Fund Managers in the case of the Infrastructure Asset Assessment, to request access to their data and GRESB results. This is referred to as a Grace Period.
The Grace Period allows participants a year to familiarize themselves with the GRESB reporting and assessment process. The names of participating entities are still visible during the Grace Period, but GRESB Investor Members, and fund managers in the case of the Infrastructure Asset Assessment, will not be able to request to see their results.
-
In response to industry feedback, the customized peer group functionality was first launched in a test phase during 2023. It is exclusive to real estate participants. It allows participants to either confirm their pre-defined peer group, as allocated by GRESB, or submit edits to the peer grouping criteria.
In 2024, participants who opt for this functionality will receive two peer group ranking on the Benchmark Report – a pre-defined and customized one. Please note that the peer groups influence neither the GRESB Score nor GRESB Star Rating.
For more information on how GRESB defines peer groups, please refer to Appendix 3b – Peer Group Allocation Methodology of 2024 Real Estate Assessment Reference Guide.
For more details of customized peer group and our current roadmap, please visit this page.
-
Please note that asset-level data of listed entities will not be shared under any circumstances due to legal reasons. This means that only the asset-level data of non-listed entities can be accessed once Benchmark Report access is granted.
You are able to access Asset Analytics of a respective entity under ‘Accessible Report’ tab. Under the drop-down menu, you will be able to access it.
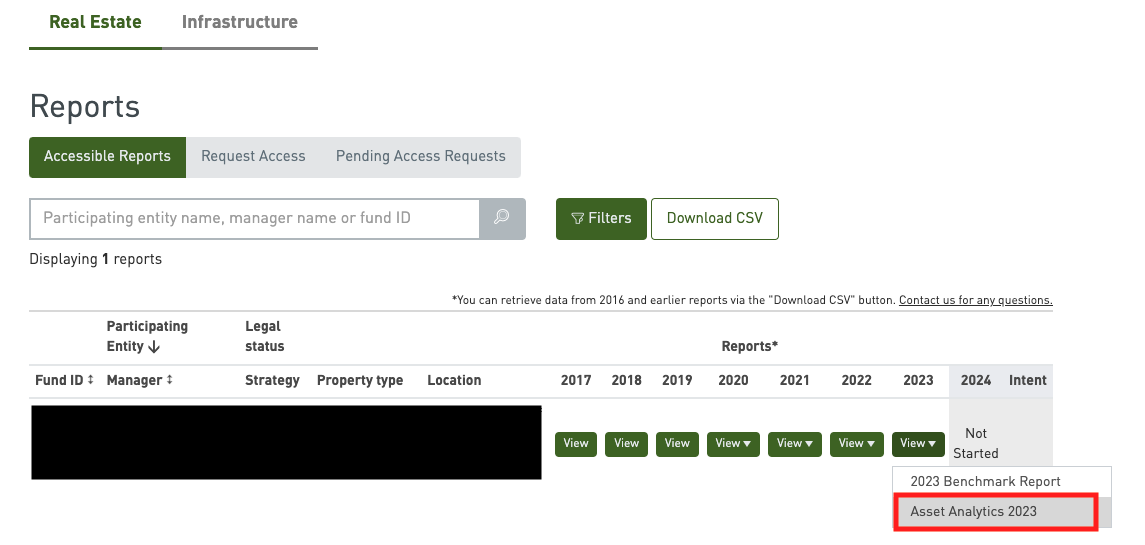
After clicking Asset Analytics, you will be able to view the following per category (energy, GHG, water and waste) on the Portal:
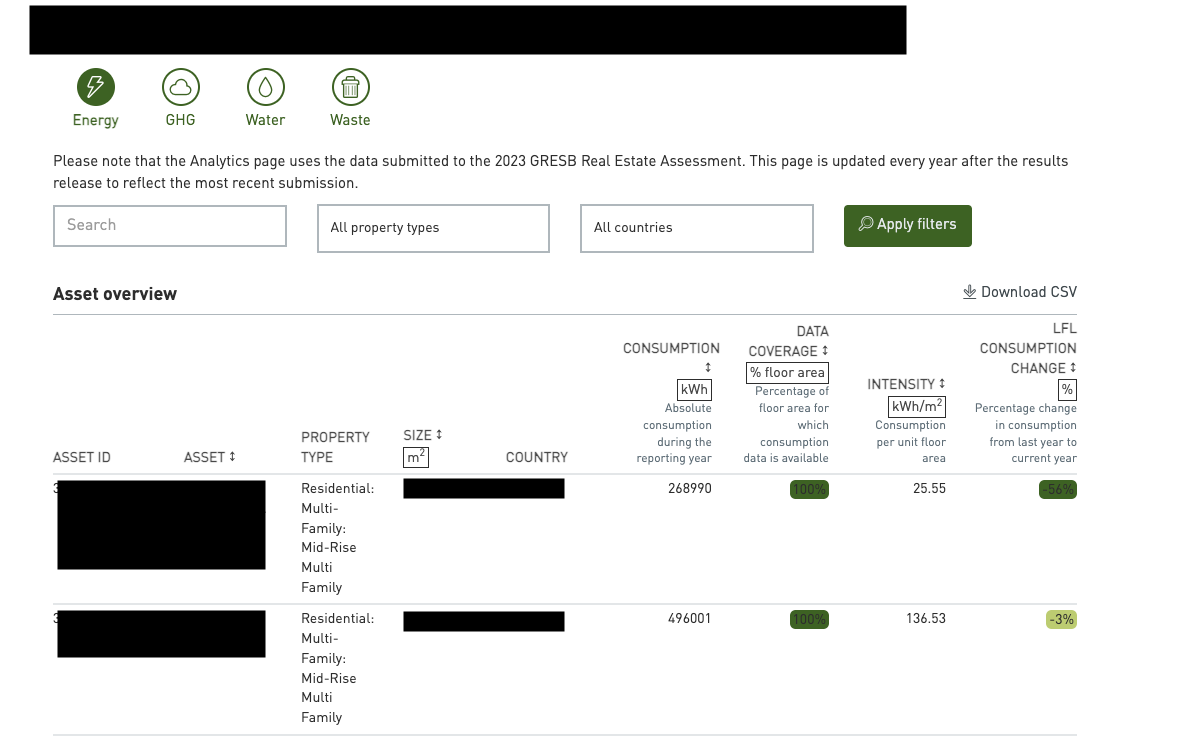
Each category commonly has the following:
- Asset ID
- Asset name
- Property type
- Size (sq. ft./m2)
- Country
Energy:
- Consumption (kWh): Absolute consumption during the reporting year
- Data coverage (% floor area): Percentage of floor area for which consumption data is available
- Intensity (kWh/sq. ft.//m2): Consumption per unit floor area
- Like-For-Like Consumption change (%):
- Percentage change in consumption from last year to current year
GHG:
- Consumption (ton): Absolute emissions during the reporting year
- Data coverage (% floor area): Percentage of floor area for which emissions data is available
- Intensity (kg/sq. ft.//m2): Emissions per unit floor area
- Like-For-Like Consumption change (%): Percentage change in emissions from last year to current year
Water:
- Consumption (kWh): Absolute consumption during the reporting year
- Data coverage (% floor area): Percentage of floor area for which consumption data is available
- Intensity (liter/sq. ft.//m2): Consumption per unit floor area
- Like-For-Like Consumption change (%): Percentage change in consumption from last year to current year
Waste:
- Consumption (ton): Absolute total waste during the reporting year
- Data coverage (% floor area): Percentage of floor area for which waste data is available
- Intensity (kWh/sq. ft.//m2): Total waste per unit floor area
- Diverted from landfill/incineration (%): Percentage of waste diverted from landfill/incineration
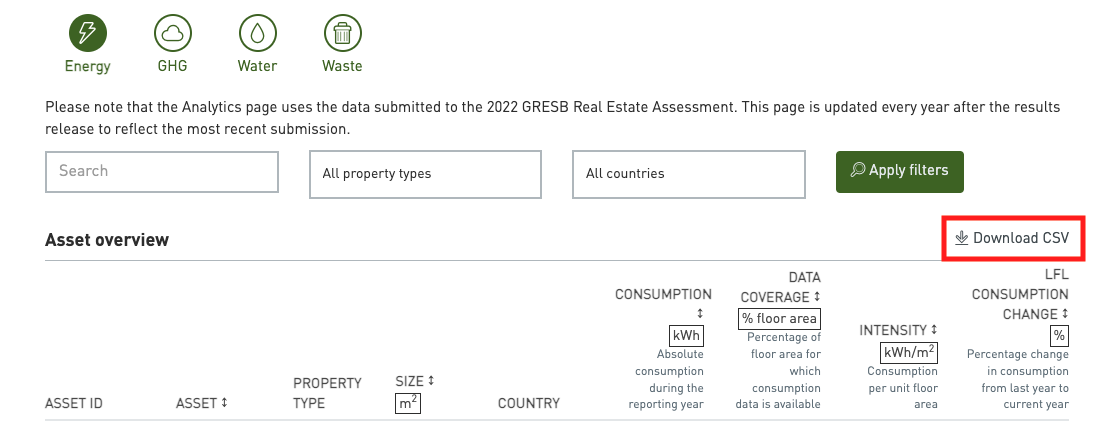
The following will also be available if the data is downloaded in CSV format:
- Asset status (standing investment, major renovation, or new construction)
- Vacancy rate
- Whether outliers exist and if so, what type of outliers (refer to this page for more information)
-
While you can request access to the entities’ Benchmark Reports, access to Asset Analytics can only be enabled by the entity on the Portal. Once the entities choose to share their asset-level data and you also have access to their Benchmark Report, you will be able to access Asset Analytics.
-
Managers can follow the steps below to share their asset-level data with Investors:
Step 1
Please head to the Assessment Portal and click on the entity concerned.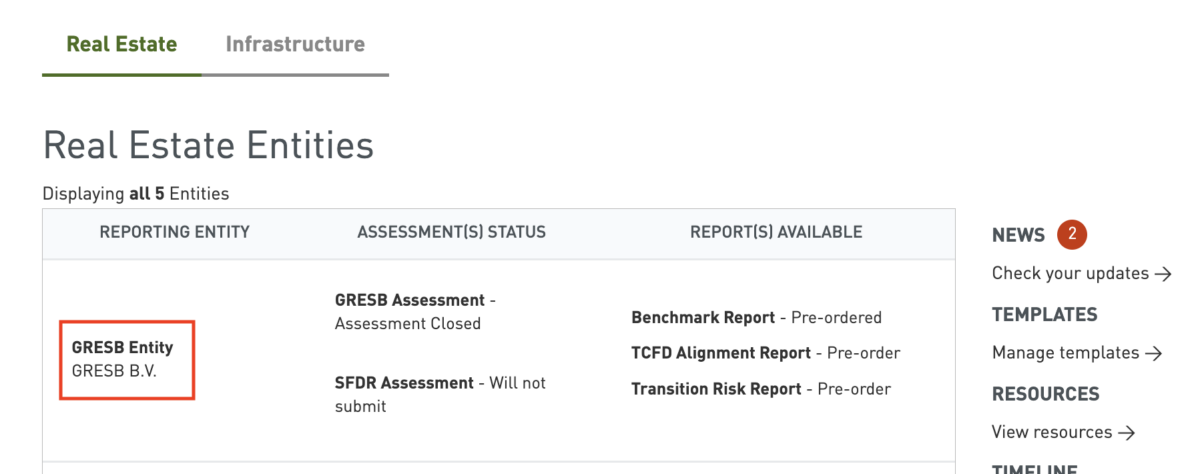
Step 2
Go to ‘More’, then ‘Response Settings’.
Please note that sharing of asset-level data must be enabled year by year. If the entity would like to share asset-level data from previous reporting years, please change the year in question in the top left-hand corner.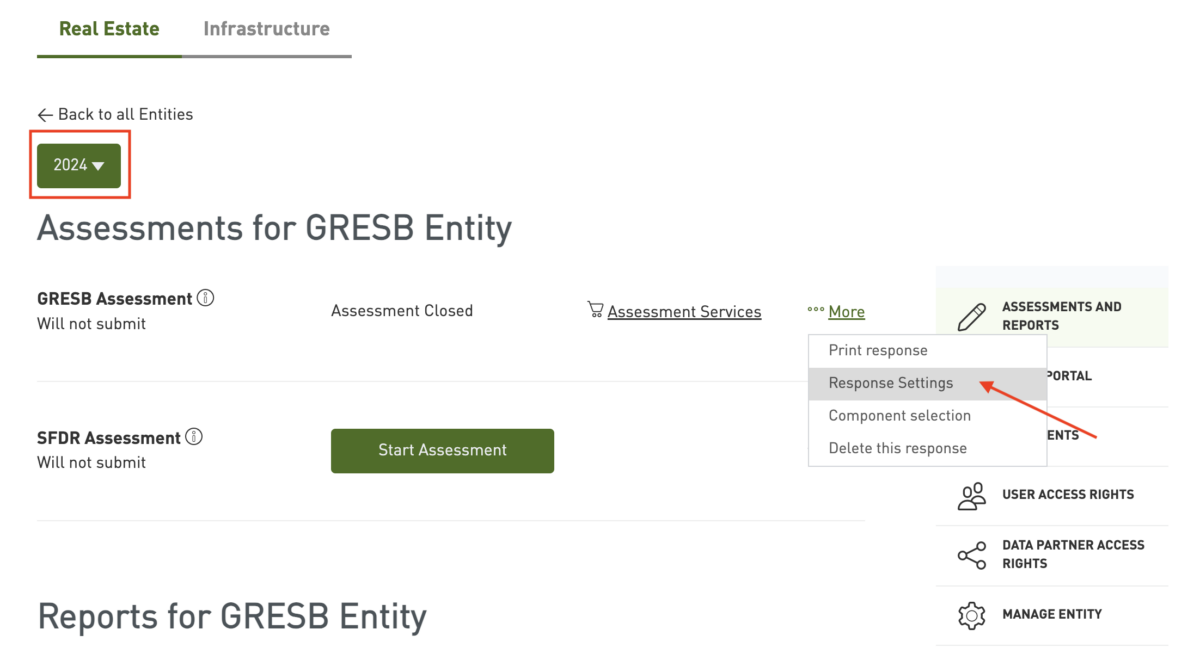
Step 3
Select ‘Yes’ under ‘Share asset data with investors (for non-listed entities only)’ and save the preference by clicking ‘Update settings’ at the bottom.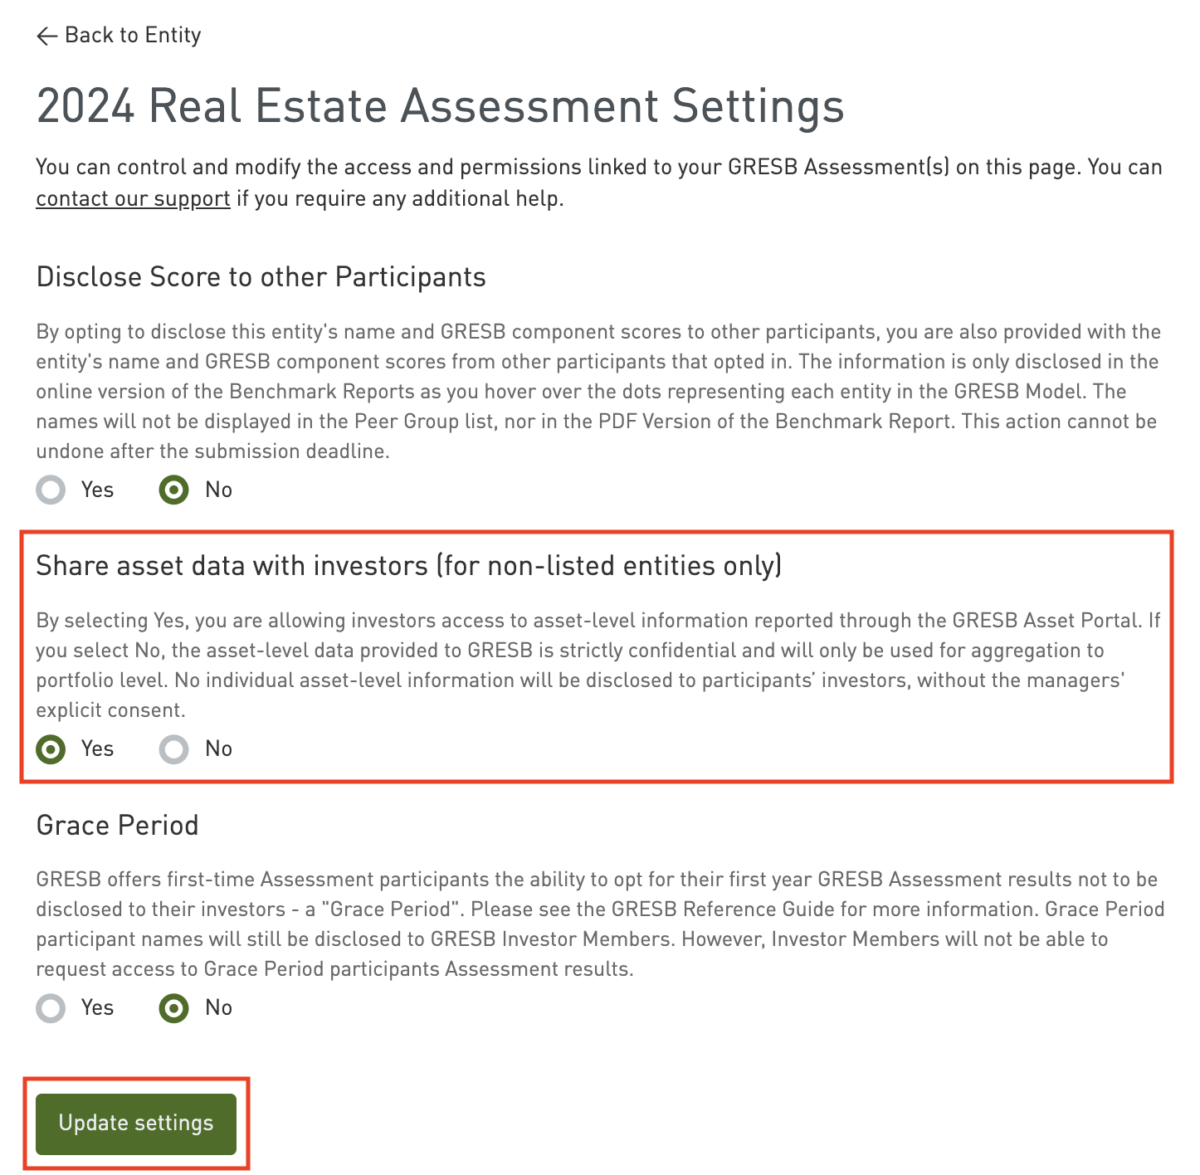
-
The Data Exporter allows users to download all the reported data points in the Assessment per accessible entity in bulk. You can find the right variables for your analyses with our search and filter functions.
If you would like to compare the aggregated performance of your portfolio against a benchmark of your choice, the Portfolio Analysis Tool is the ideal tool to do so. Users can define the benchmark based on different criteria drawn from our entire participant universe for a useful analysis. For example, if you want to benchmark your portfolio against all European industrial entities, it is possible to do so.
The Carbon Footprint Dashboard empowers real estate Investor Members to explore and better understand the energy consumption and greenhouse gas (GHG) emissions of their GRESB Real Estate portfolios. We utilize the GRESB Estimation Model to fill in data gaps if needed. The GEM leverages more than 170,000 assets in our global database to generate a highly representative estimation for energy consumption data.
-
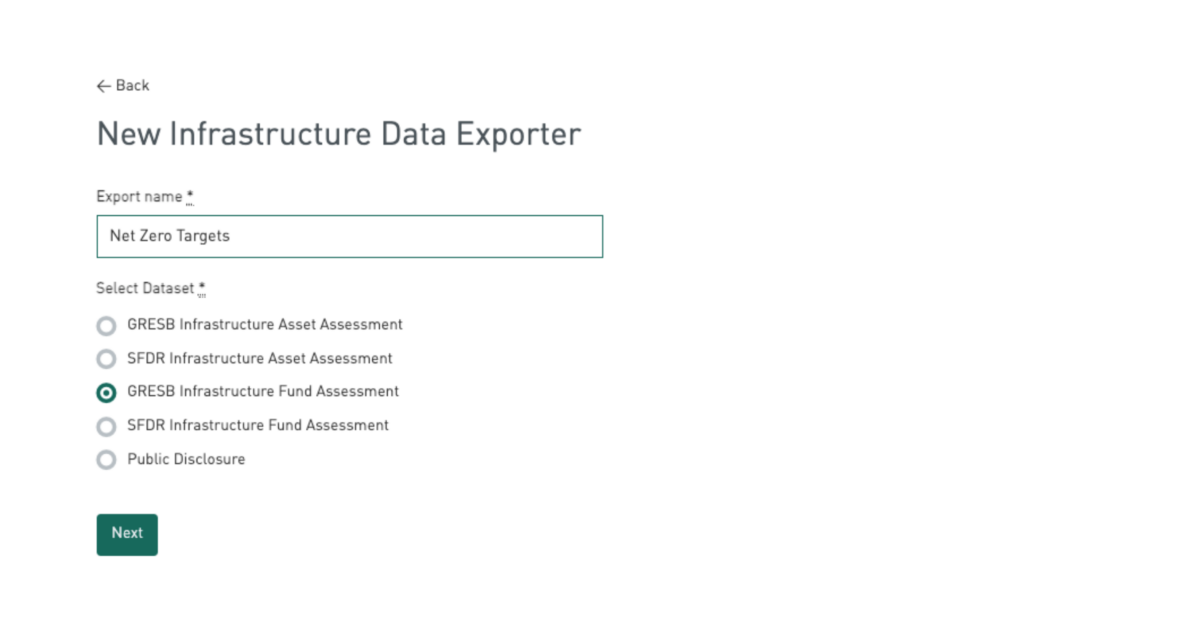
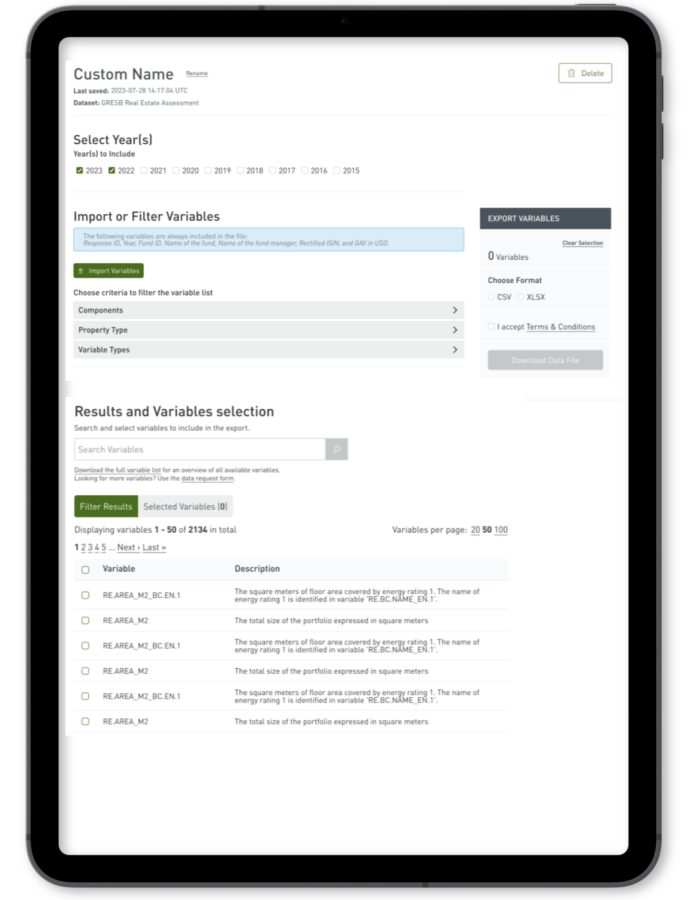
You may use the Data Exporter to download the relevant data to facilitate your own analyses.
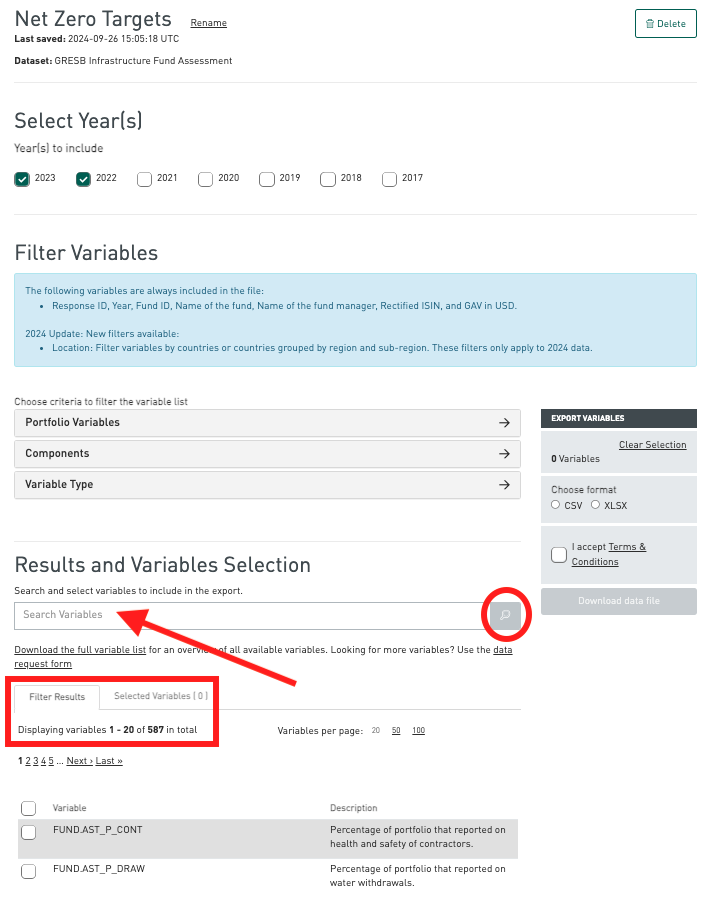
After clicking on ‘Create a new data export’ and choosing the relevant Assessment, you can select the desired variables with our search function. By using the search function, the scope will be narrowed down from thousands of variables to only a hundred, and you will be able to see the relevant variables with descriptions.
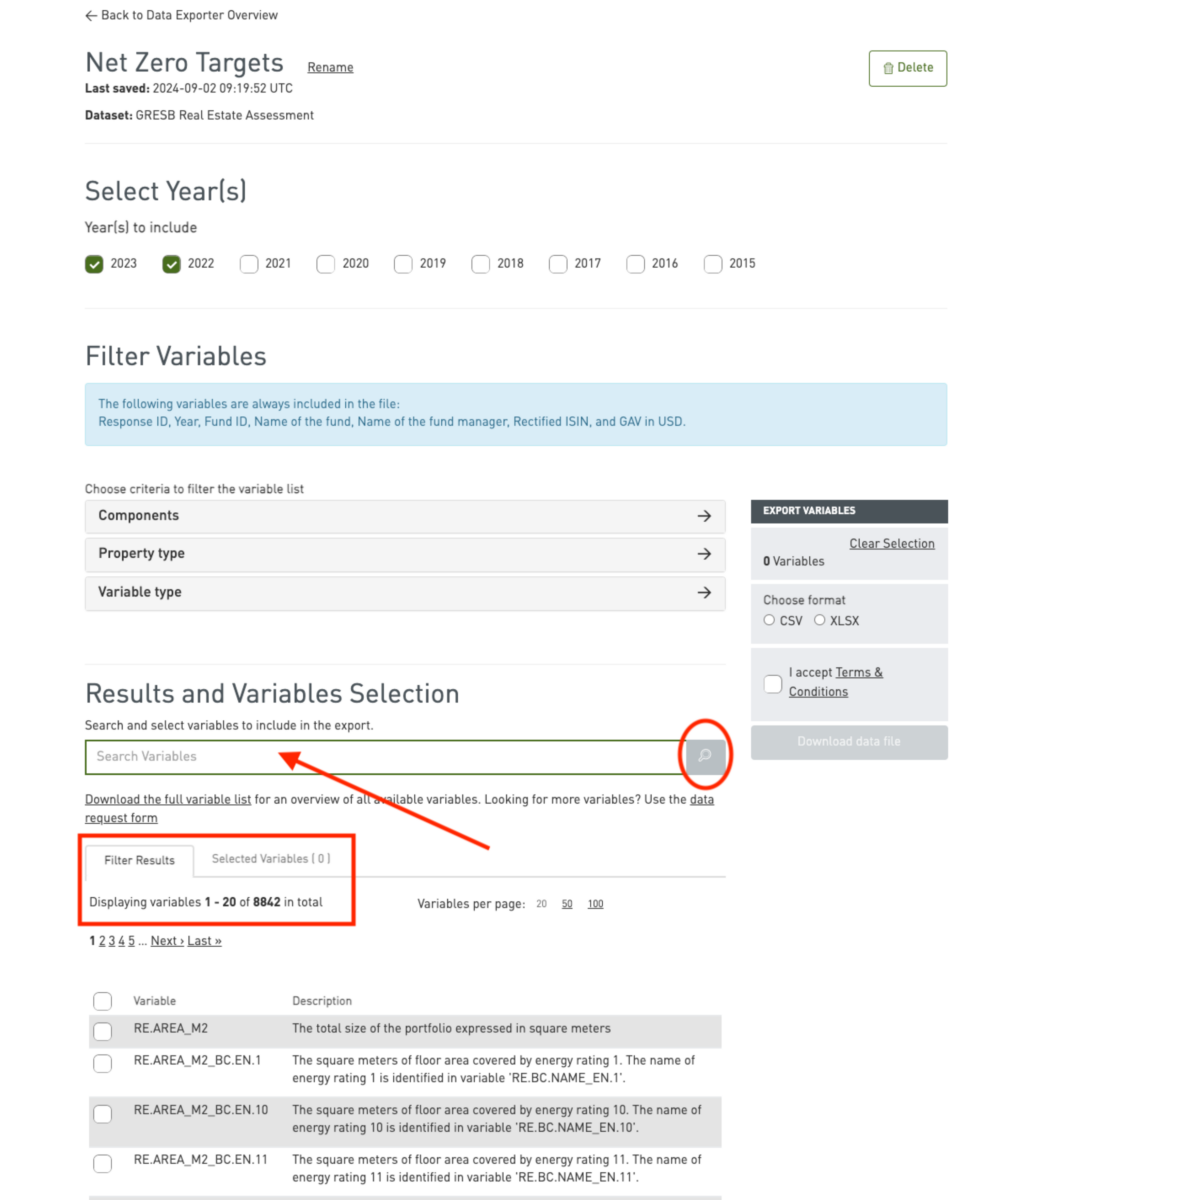
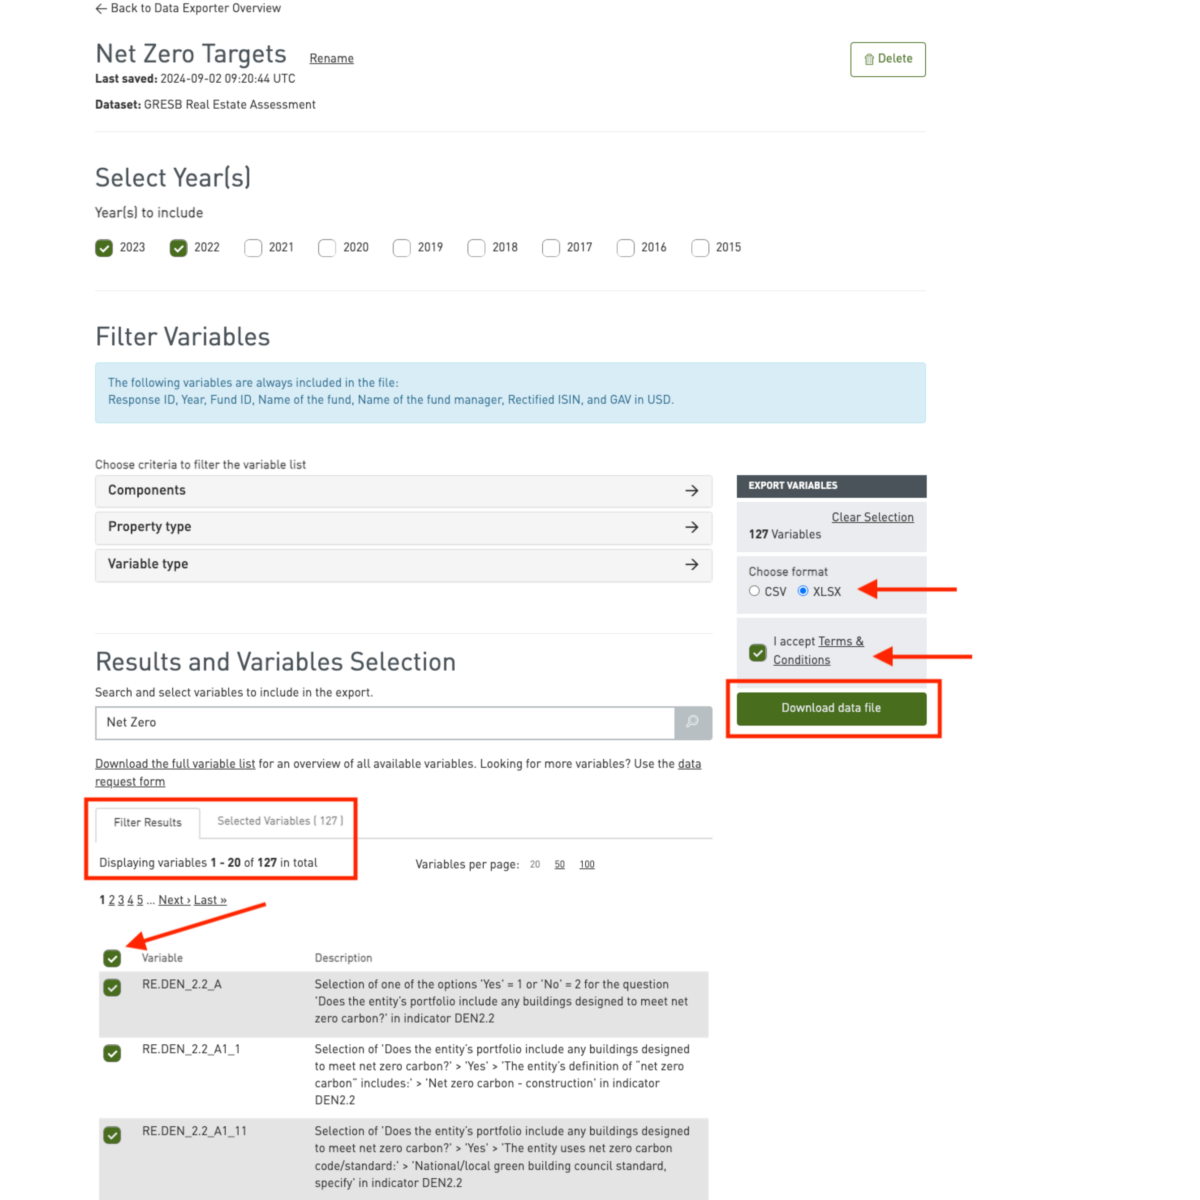
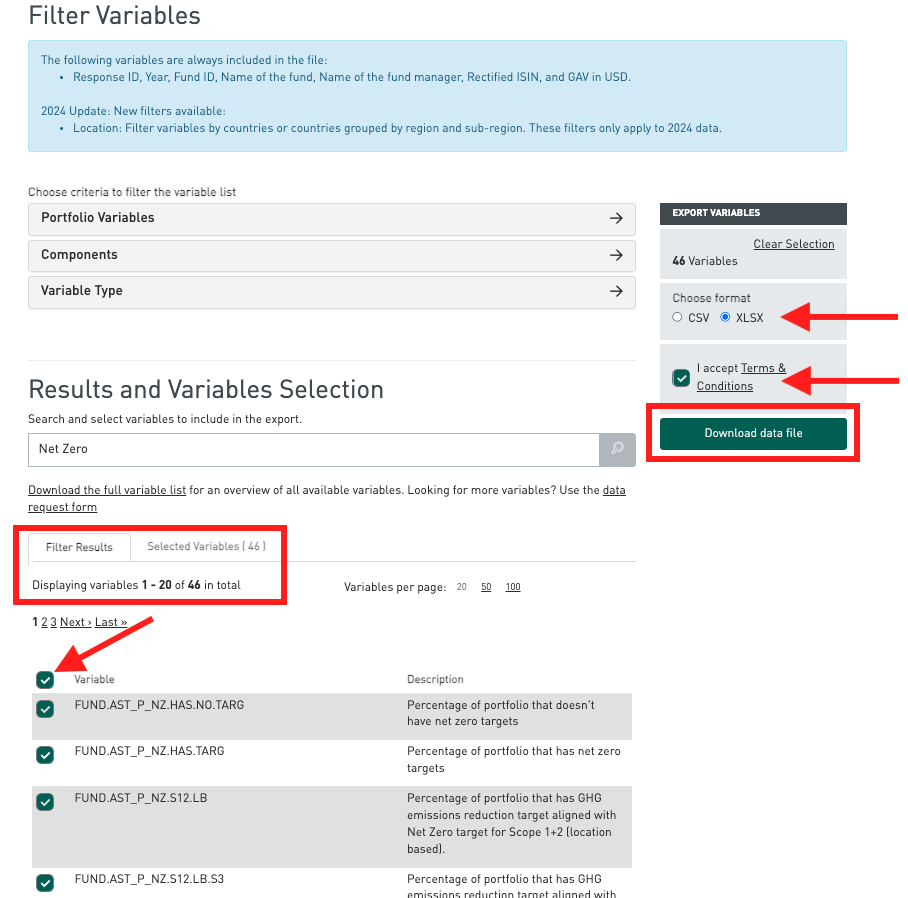
You can check the box in the top row to select all the relevant variables or select them individually. Please choose the desired format (i.e. CSV or Excel) and accept the terms and conditions for a successful download.
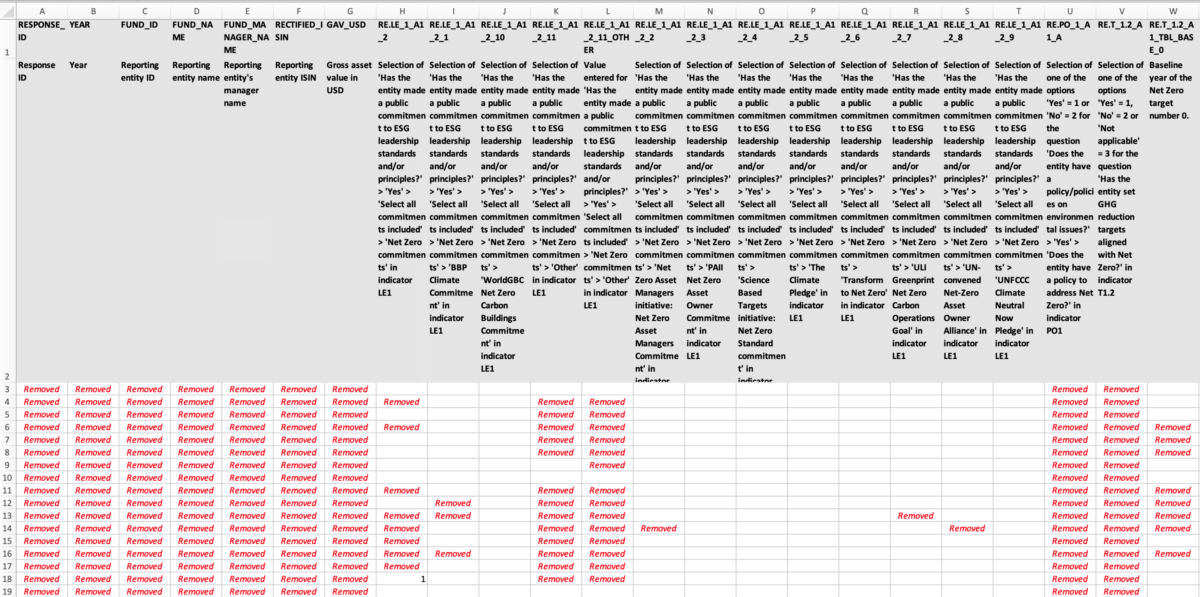
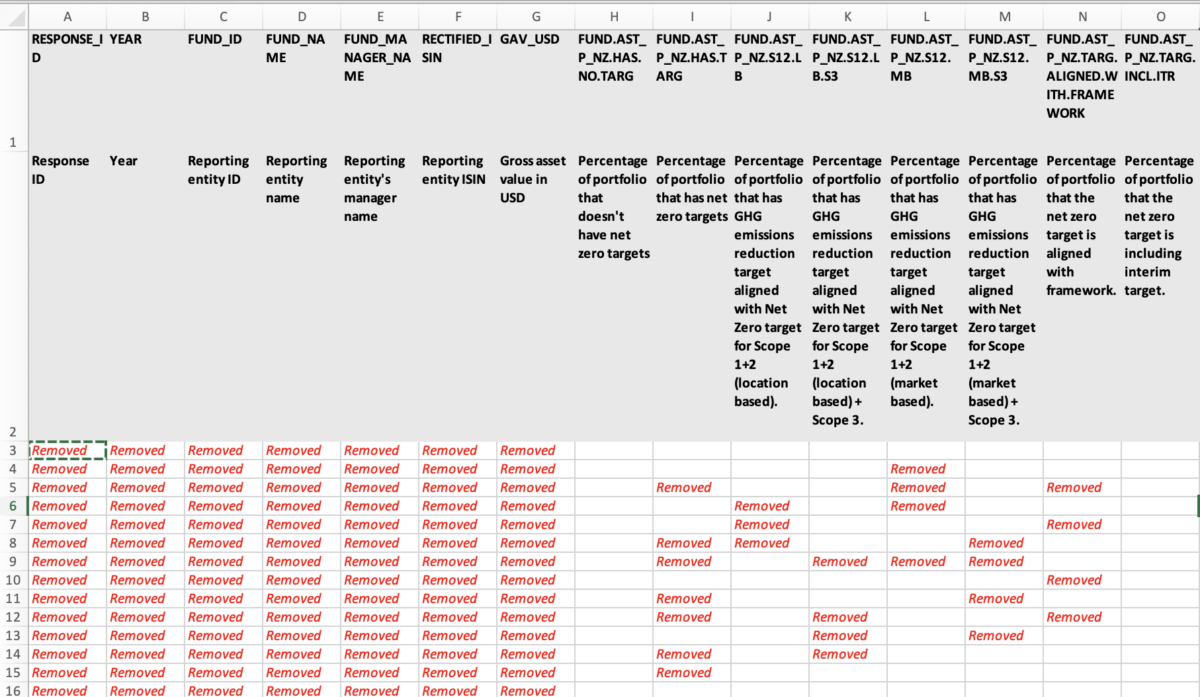
Below is an example of how the export will be displayed in an Excel format.
-
On the Data Exporter, for data related to the indicators under the Management and Development Component, they are assessed and available at the entity-level.
Example indicators
[Management Component] PO1 – Does the entity have a policy/policies on environmental issues?
[Development Component] DMA2 – Does the entity assess the life cycle emissions of its development projects?
As for indicators under the Performance Component (such as energy consumption, GHG emissions, water consumption, waste), they are available at a more granular level.
In the meantime, if you would like to see the following aggregated data, please refer to the ‘Portfolio Impact’ section of the Benchmark Report.
- Energy: Absolute consumption, data coverage, amount of renewable energy, like-for-like change & impact, and portfolio improvement targets
- GHG: Absolute emissions, date coverage, quantity of GHG offsets, like-for-like change & impact, and portfolio improvement targets
- Water: Absolute consumption, data coverage, amount of water reuse, like-for-like change & impact and portfolio improvement targets
- Waste: Absolute amount, data coverage, amount of diverted waste, and portfolio improvement targets
Please refer to our latest Standard and Reference Guide to see how the Assessment/indicators are structured, which can be accessed here.
-
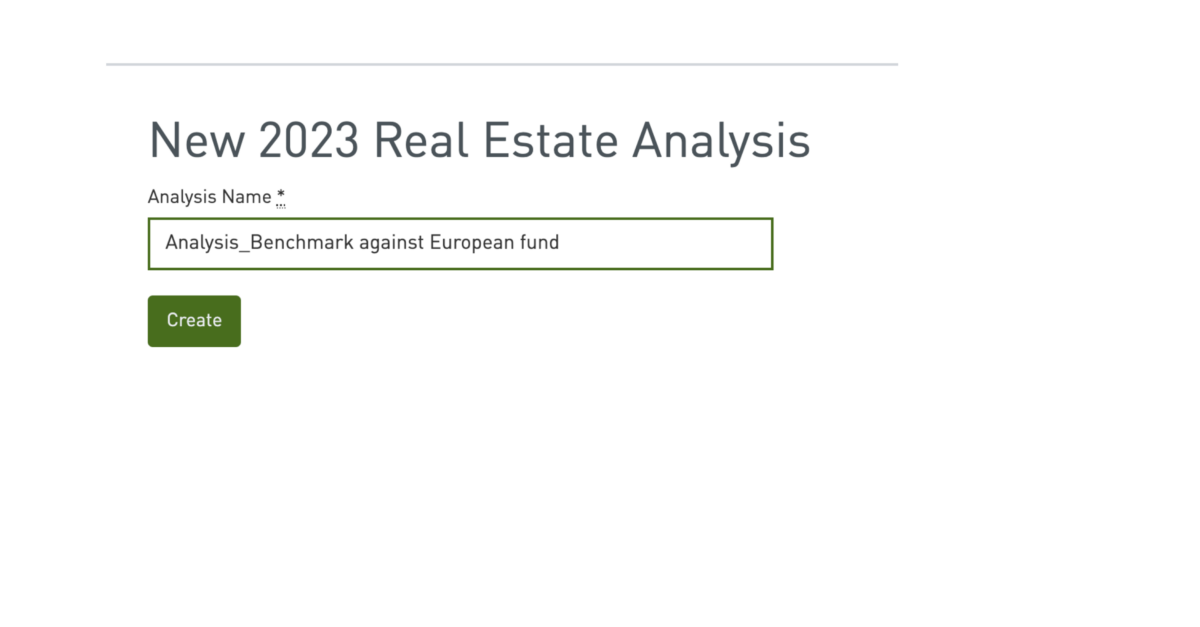
You can use the Portfolio Analysis Tool to make such an analysis.
Name your analysis and click ‘Create’.
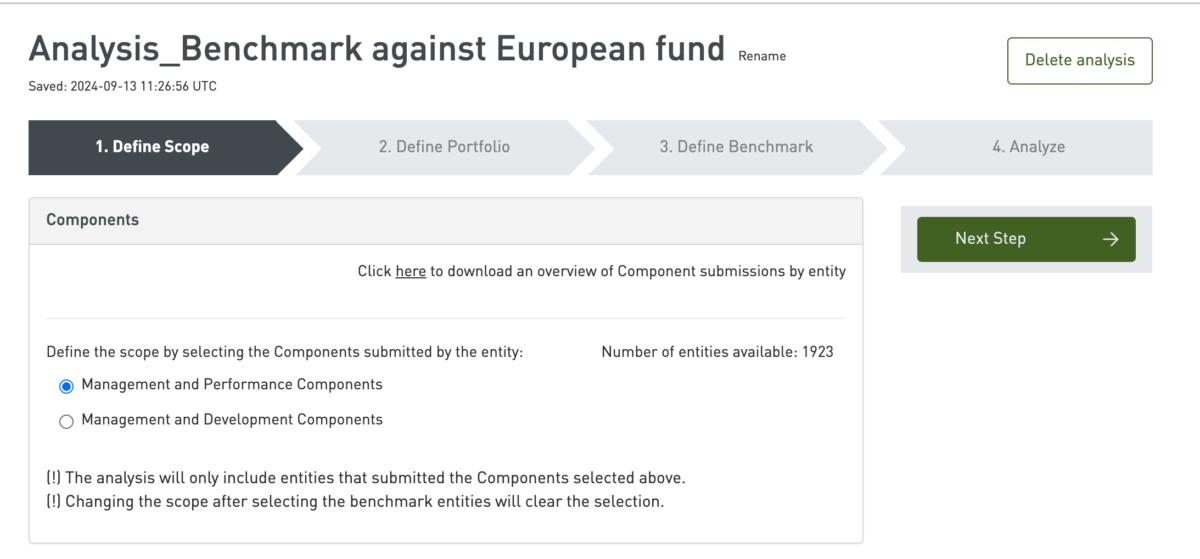
Select the appropriate benchmark. The Real Estate Assessment generates two Benchmarks: (1) Standing Investment Benchmark (entities completing Management and Performance Component); (2) Development Benchmark (entities completing Management and Development Benchmark).
GRESB does not require entities to submit to certain Components.
Real Estate
- Management Component – measures the entity’s strategy and leadership, management, policies and processes, risk management, and stakeholder engagement approach, composed of information collected at the entity level.
- Performance Component – measures the entity’s asset portfolio performance, composed of information collected at the asset level. It is suitable for any real estate company or fund with operational assets.
- Development Component – measures the entity’s efforts to address ESG-issues during the design, construction, and renovation of buildings. This component is suitable for entities involved in new construction (building design, site selection and/or construction) and/or major renovation projects, with ongoing projects or completed projects during the reporting year.
GRESB does not require participation in any of the Assessment Components. However, if the entity has both standing investments and development projects, and it considers itself both an operator of buildings and involved in development activities, it is highly recommended to participate in both benchmarks. As a result, participants will receive two GRESB Scores, two Benchmark Reports, two pre-defined peer groups, etc. capturing how the entities approach their respective activities in both benchmarks.
In this example question, since the German entities under your portfolio only have operational assets, they would only be part of the Standing Investment Benchmark and thus you should choose ‘Management and Performance Component’.
There are 1923 entities available, which means there were 1923 entities within the Standing Investment Benchmark in the GRESB universe.
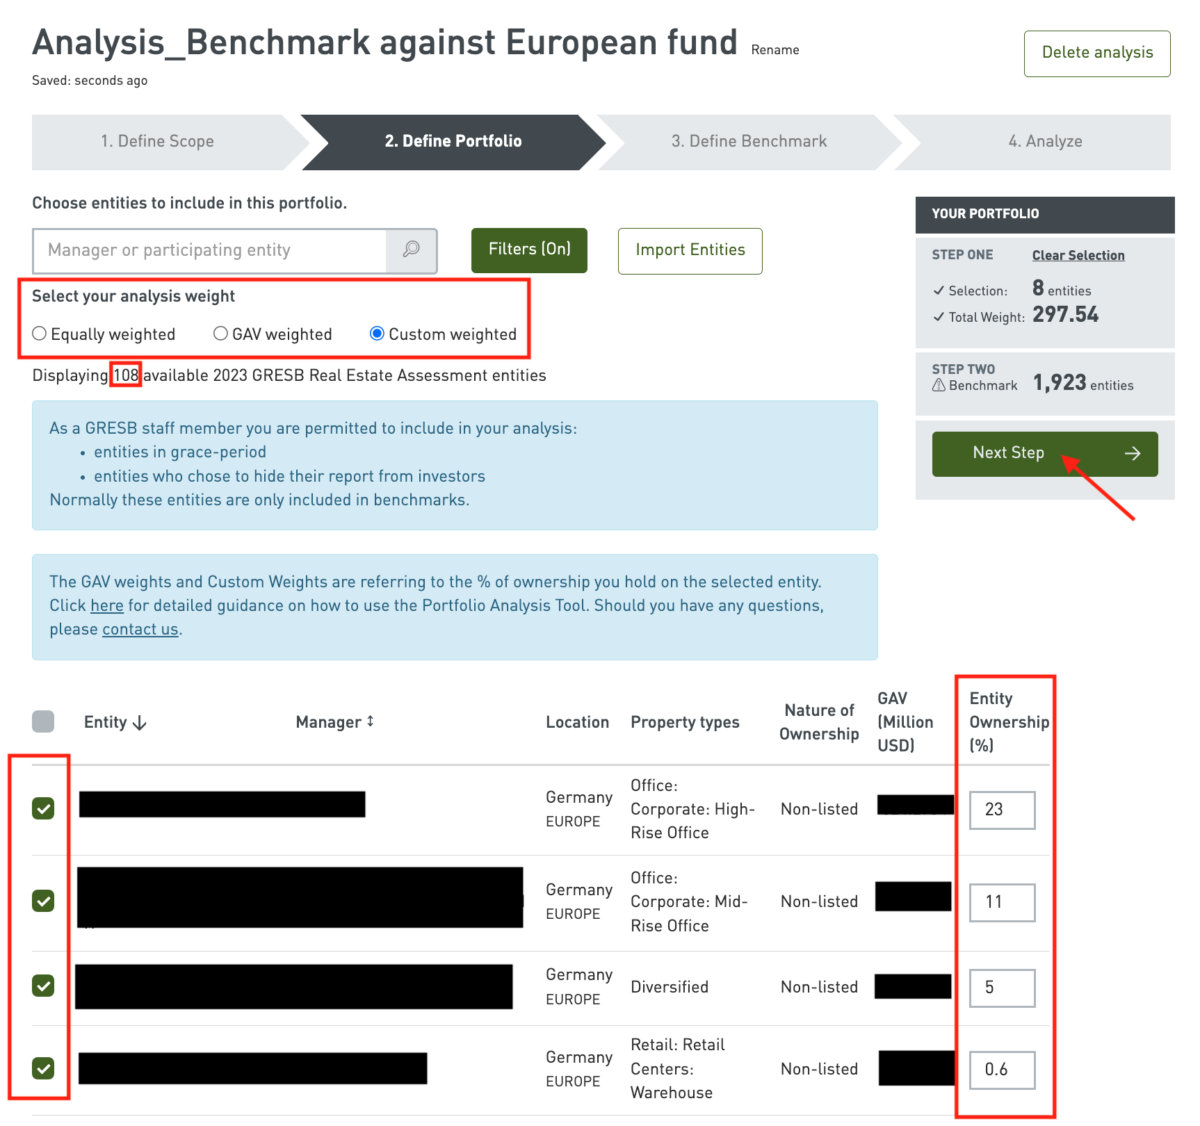
You can directly select the German entities using the search function, or you can filter the results to find them. Note that the display only shows the entities that you have access to.
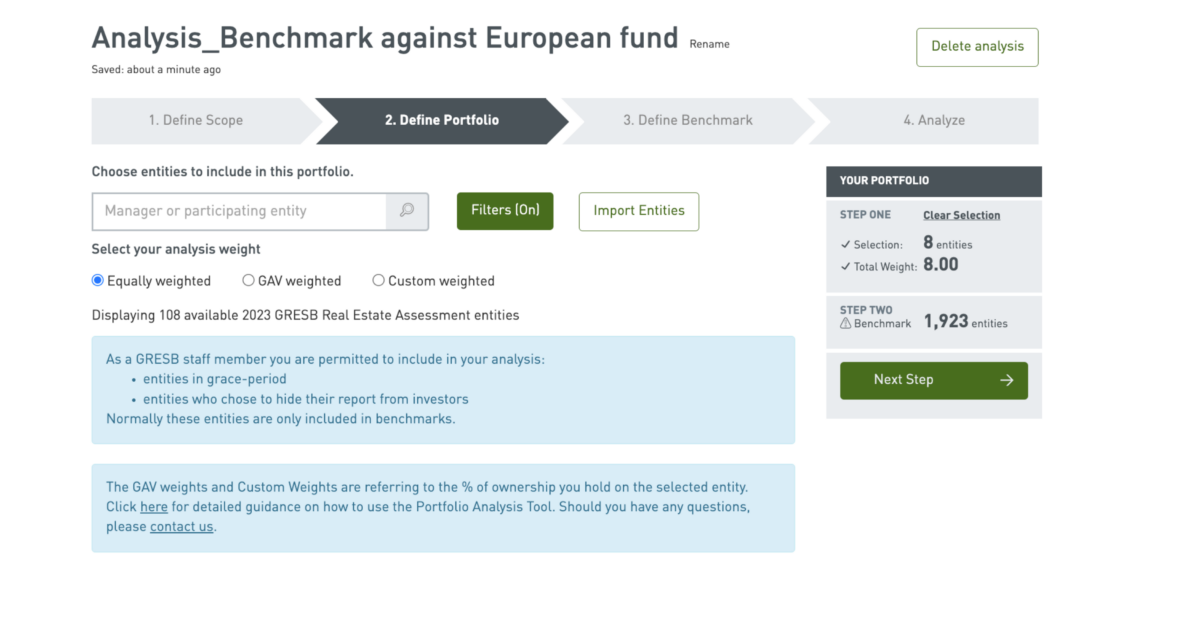
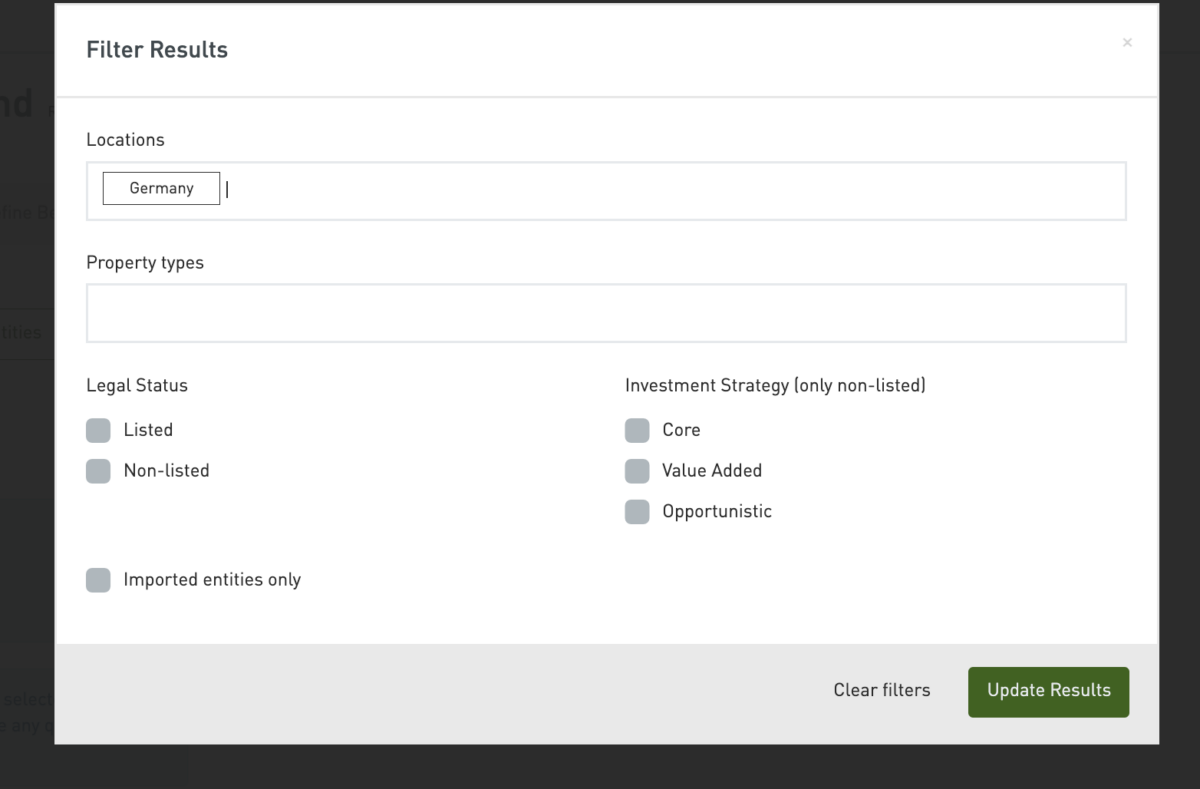
After applying the filter, you can see that the list of relevant entities is narrowed down. Then, please select the relevant entities to compose your portfolio by checking the boxes next to the entities.
Now, you must assign a weight for the analysis. Different weighting options have the following impact on the aggregation:
- GAV weighted:
Scores and other percentage metrics (e.g. Data Coverage, etc) are aggregated as the weighted average of the individual metrics of the Portfolio’s constituents, using their GAV as weighting factor.Absolute performance metrics (e.g. Energy Consumption, GHG Emissions, etc) are aggregated as the sum of all constituents in the Portfolio. - Equally weighted:
This option only applies to Scores. Each entity’s score carries the same weight in the aggregated Portfolio Score. If this option is selected, the performance metrics of the analysis (i.e. the Portfolio Impact section) will not be displayed. - Custom weighted:
The values of the percentage custom weights will be divided by the GAV of the respective entity (expressed in USD) to determine the Weight used in the aggregation of absolute performance metrics in the Portfolio Impact section (e.g. total energy consumption, total GHG emissions of the Portfolio). The scores and other performance metrics, such as data coverage, are aggregated using a weighted average of the assigned Weights.
Note that if custom weighted is selected, it is mandatory to put down entity’s ownership (%).
Click ‘Next Step’ to proceed after confirming the selection and the total weights.
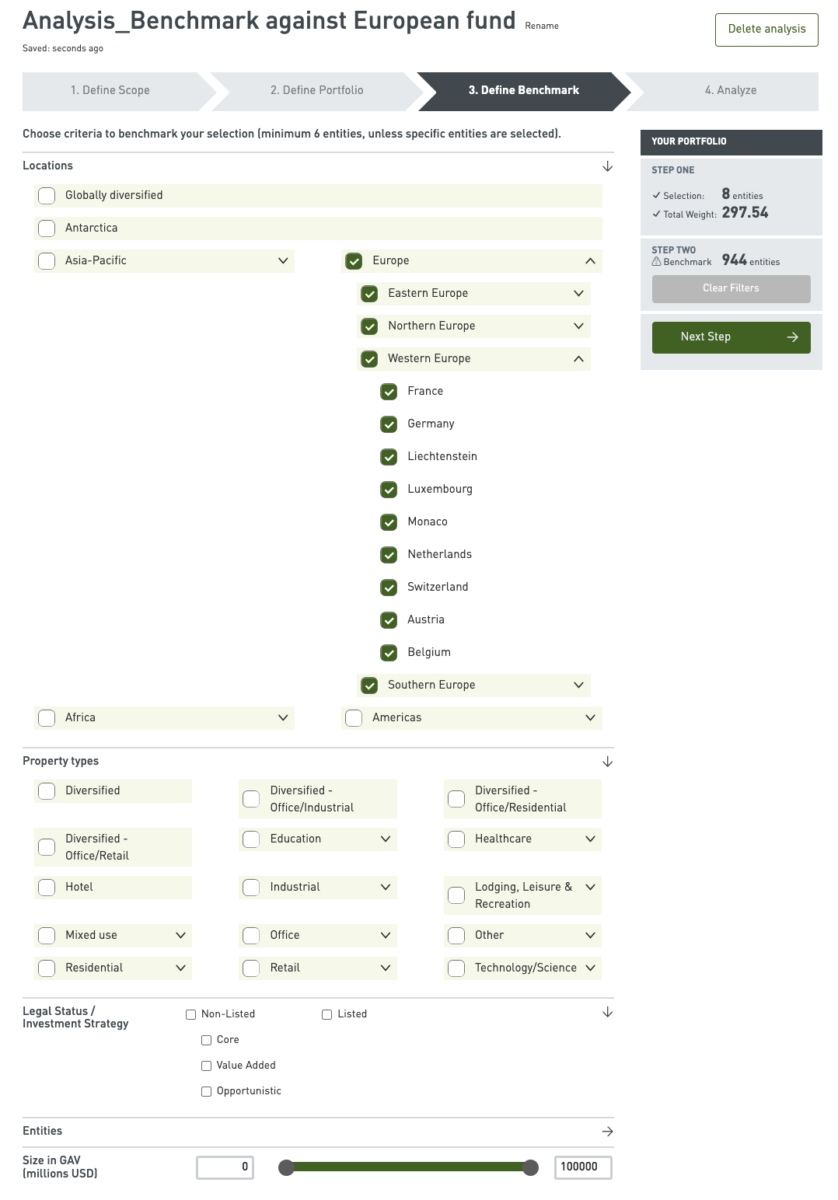
When defining the Benchmark, there are different criteria available. In this example, you should choose all of ‘Europe’ under the ‘Location’ criteria. It shows that your portfolio will be benchmarked against 944 entities that are within this Standing Investment Benchmark and Europe.
Click ‘Next Step’ to generate the analysis.
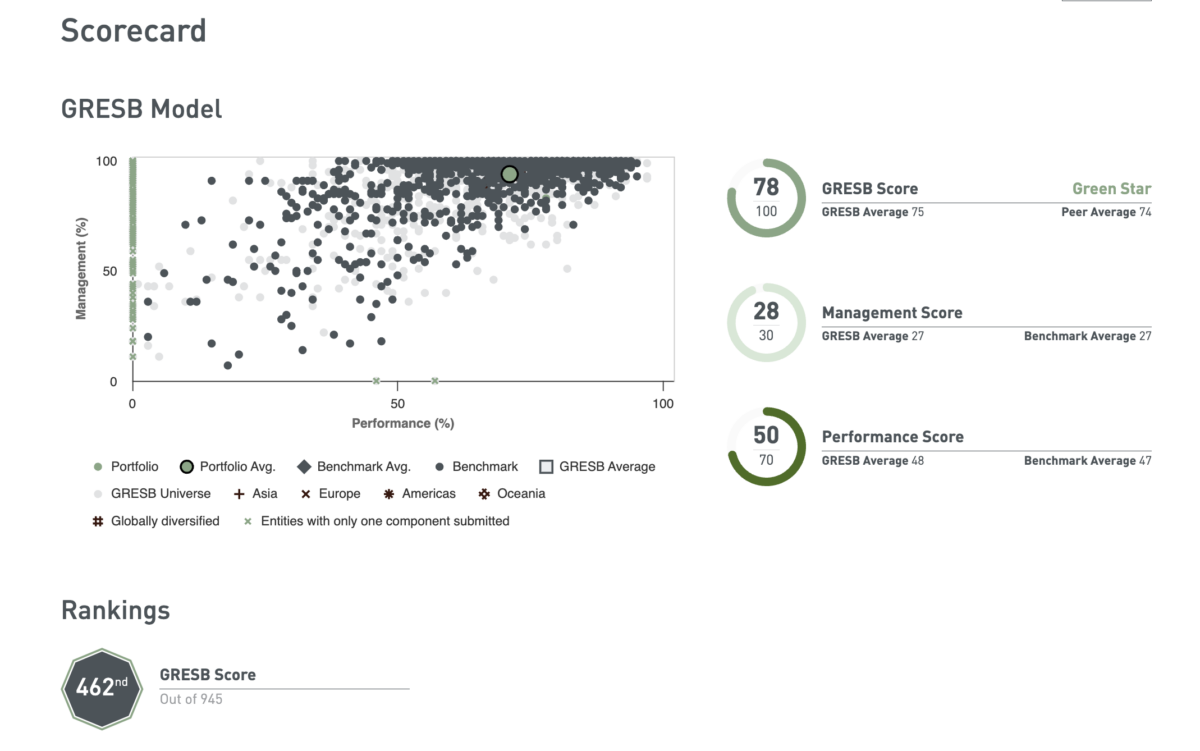
Finally, you will be able to see the analysis as below. Note that the screenshot below only shows the top part of a regular Portfolio Analysis report. Scroll down in your own report for more granular insights.
-
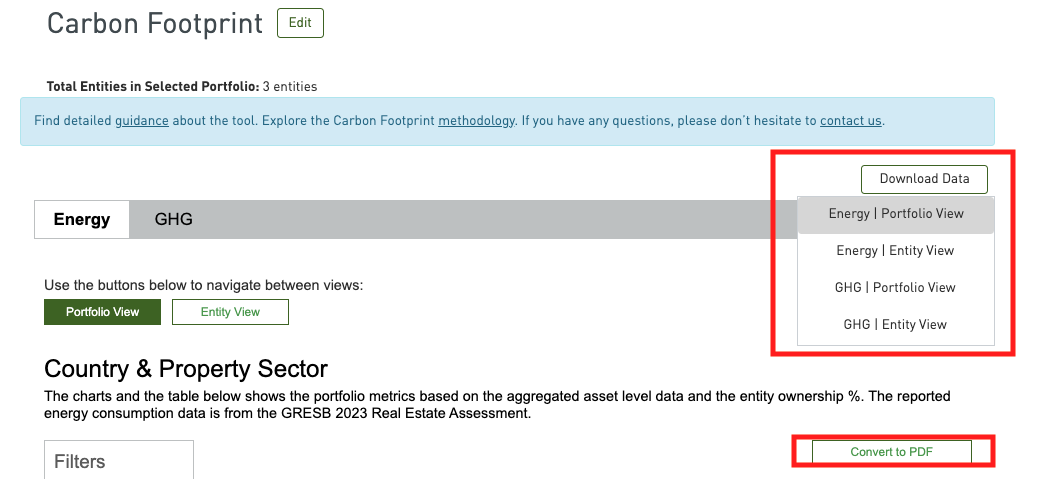
This data is available in the Carbon Footprint Dashboard for GRESB Real Estate Investor Members.
After accessing the Carbon Footprint Dashboard through the GRESB Portal, first, please choose the preferred unit – either m2 or ft2.
Then, select entities to compose your portfolio. Note that at least two entities have to be selected. It is also mandatory to enter the entity ownership in percentage in order to calculate the share of financed emissions.
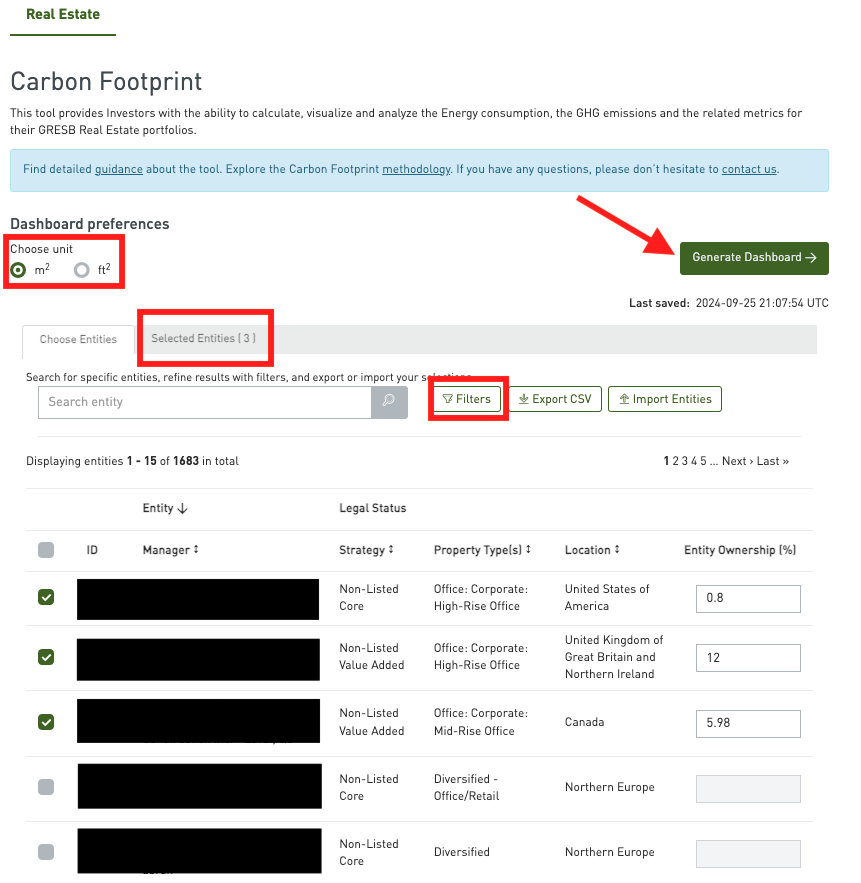
You can also have an overview of the selection and remove some of them at tab ‘Selected entities’.
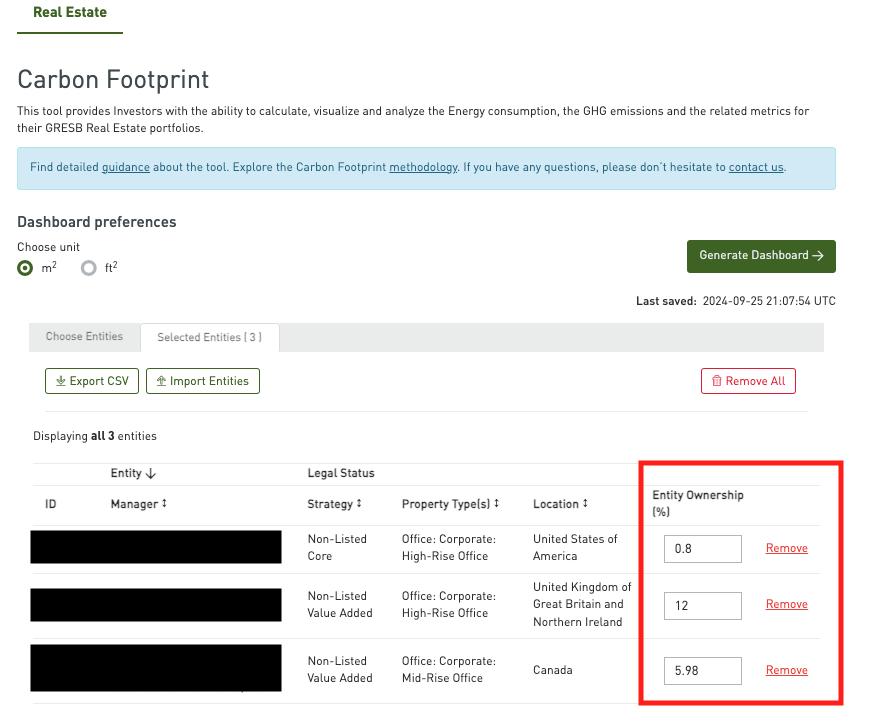
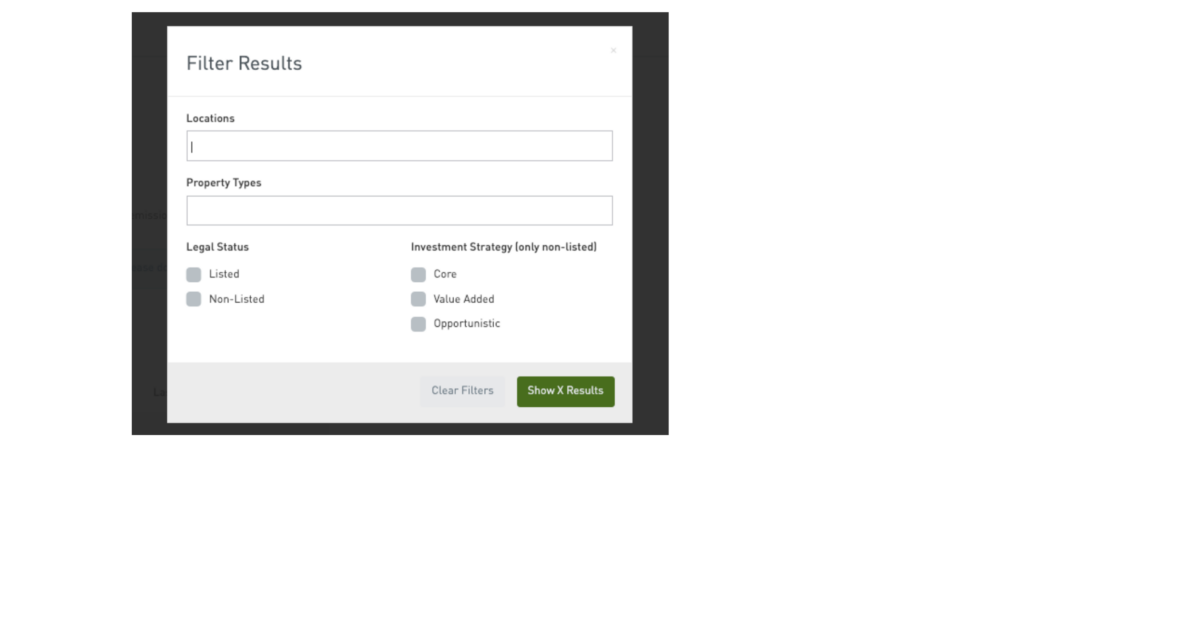
In case you have access to a considerable number of entities, you may wish to use the filter to search for the relevant entities. It is possible to filter by locations, property types, legal status and investment strategy.
Finally, please click ‘Generate Dashboard’.
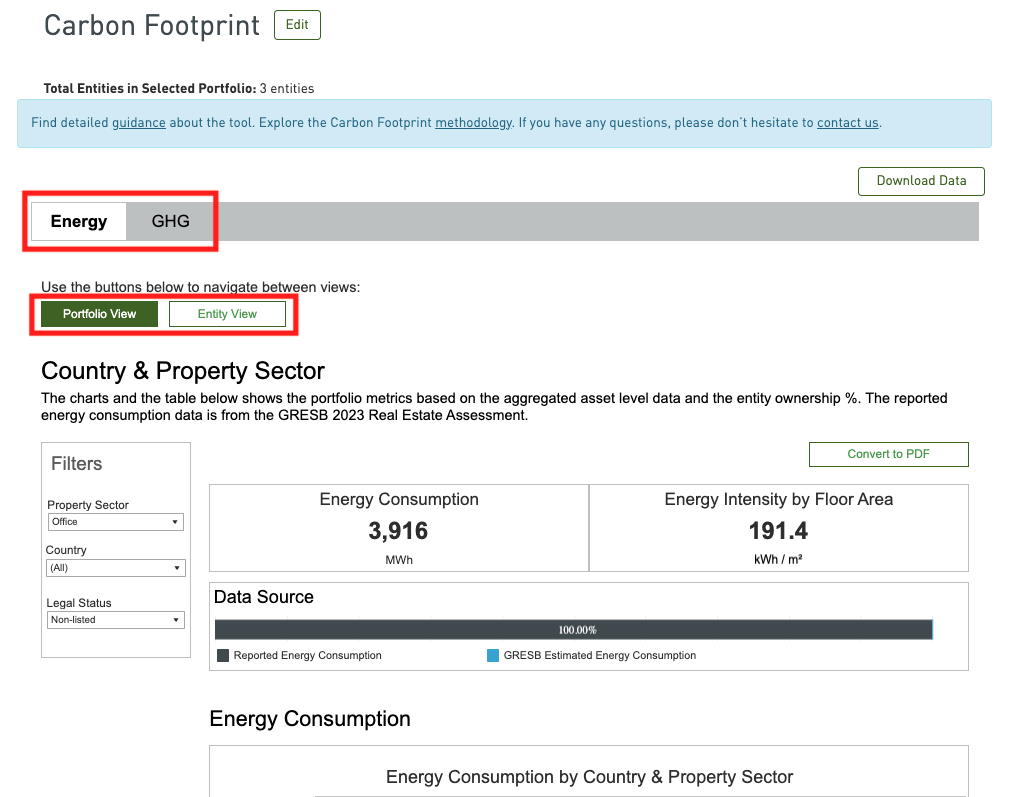
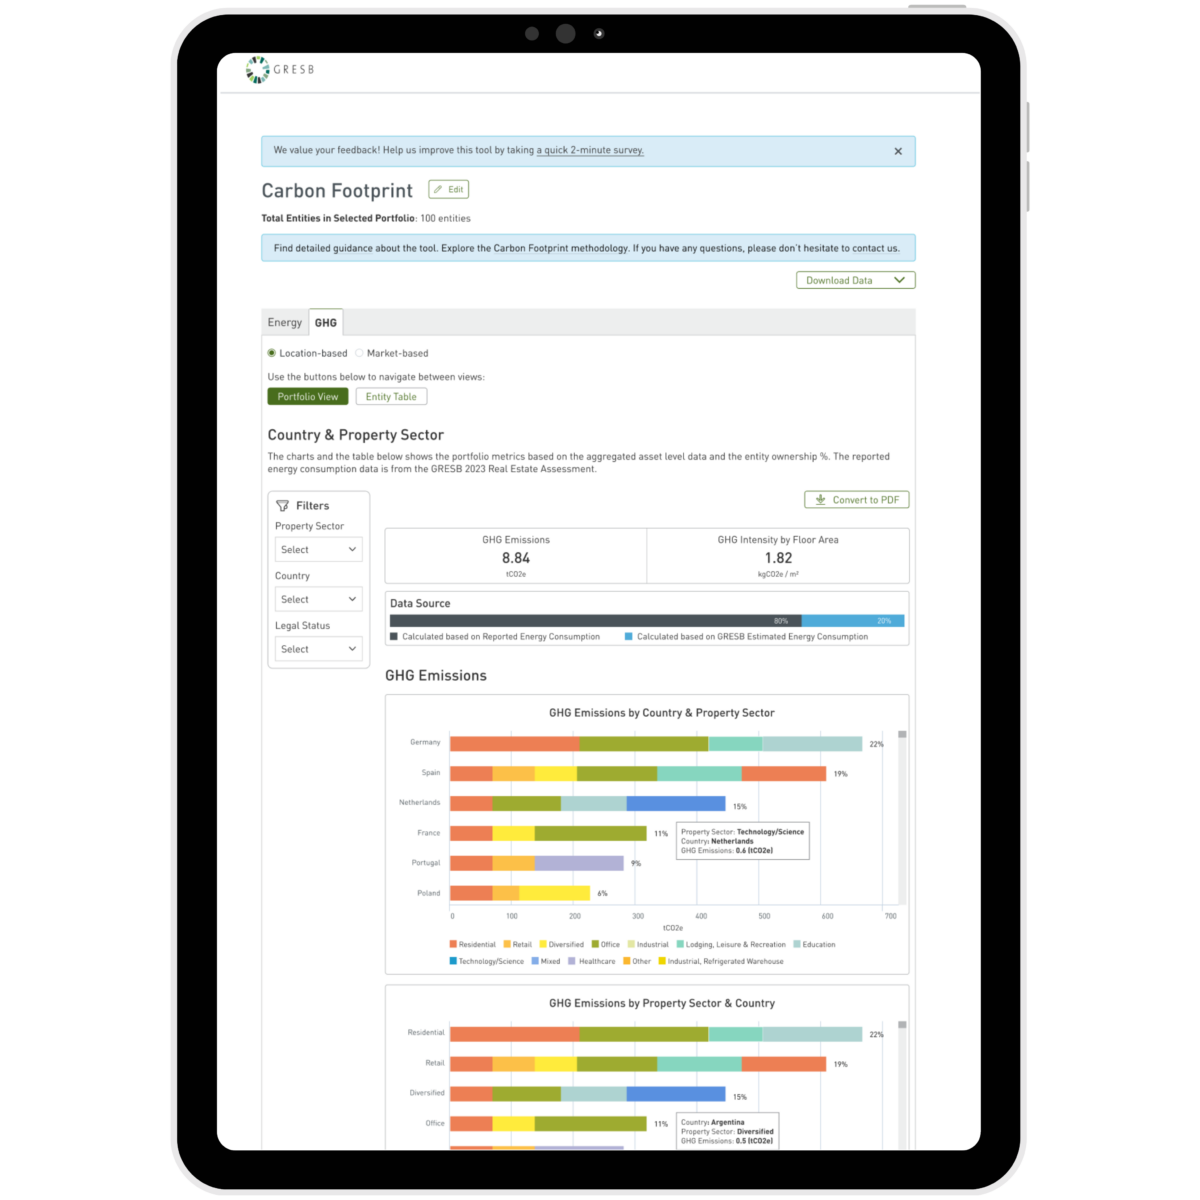
You will be able to see the energy consumption and GHG emissions by changing the tabs. Users can also view it at portfolio or entity view. When scrolling down, the Carbon Footprint Dashboard offers break-down by country and property sector.
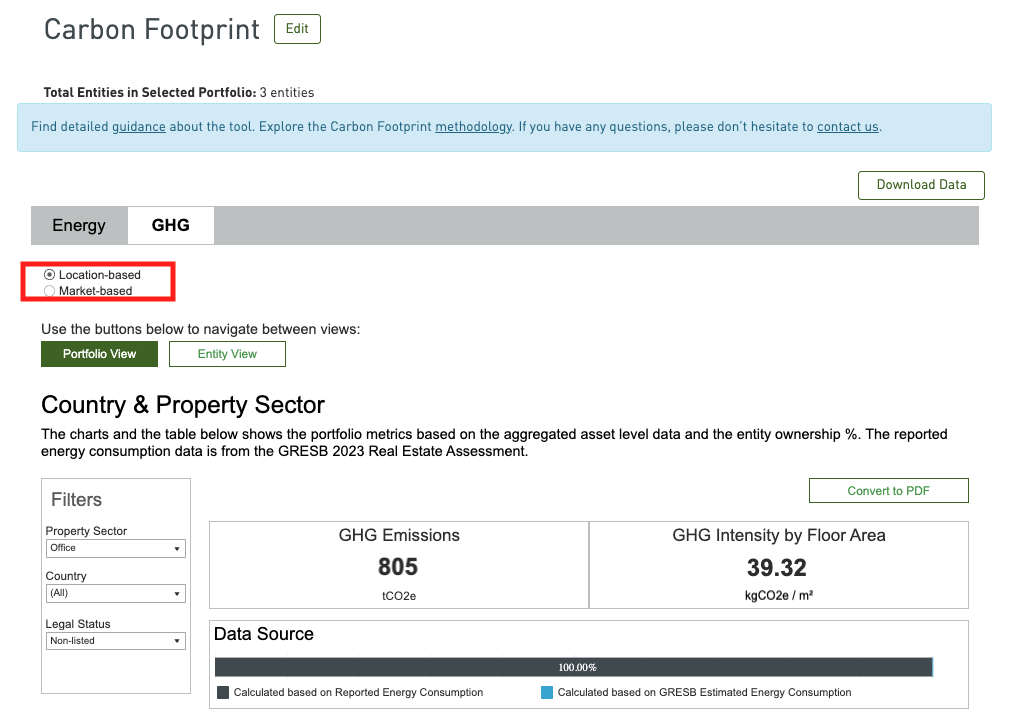
The GHG tab is similar to Energy tab except there is an option to choose between market-based or location-based and it provides a breakdown of emissions by Scope.
Users can also download the data in excel format or convert the charts to PDF.
Infrastructure FAQ 2024
-
Please reach out to your account manager at GRESB to manage users within your Investor Membership.
-
This depends on the type of subscription you have. When signing up to the GRESB Investor Membership, you may purchase the following subscriptions:
- Real Estate | Listed
- Real Estate | Non-listed
- Infrastructure | Listed
- Infrastructure | Non-listed
With a listed subscription, you will, by default, have access to all Benchmark Reports and other reports of listed entities (such as Transition Risk Report, SFDR Report, TCFD Report, if the entities have purchased those).
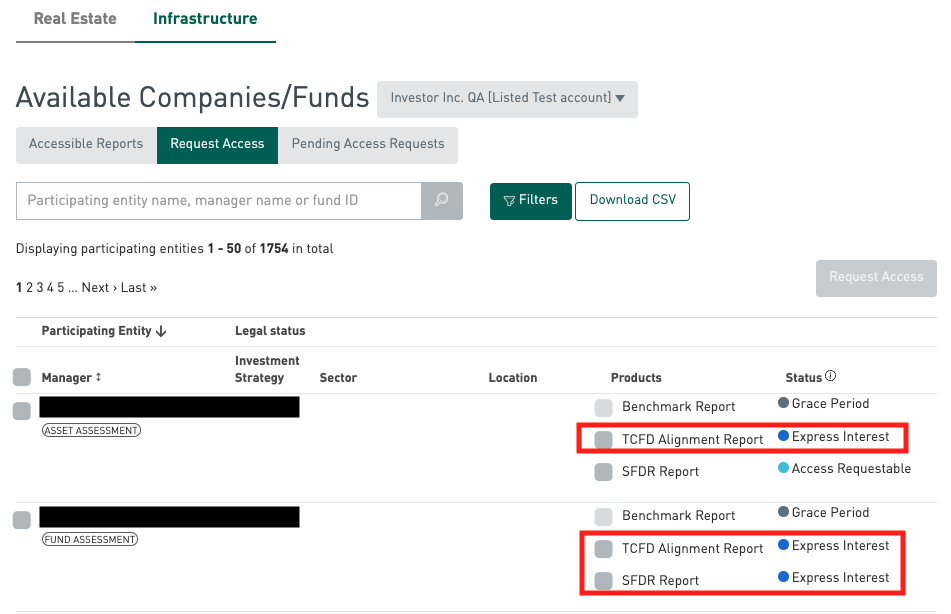
As for non-listed subscriptions, you can request access to participants’ Benchmark Reports in the Portal. Once the entities grant access, you will be able to access the reports. Note that access for different reports must be requested individually, meaning that having access to an entity’s Benchmark Report does not automatically mean you also have access to their Transition Risk Report. You can request access next to reports that are shown as ‘Access Requestable’.
-
Expressing interest means the entity in question has not purchased the specific report yet. With your expression of interest, they will be notified and can consider whether to purchase the product. After the purchase and release of the reports, they can then decide whether to share it with individual Investor Members. You can express your interest under the ‘Request Access’ tab.
You can always cancel your request under tab ‘Pending Access Requests’ as well.
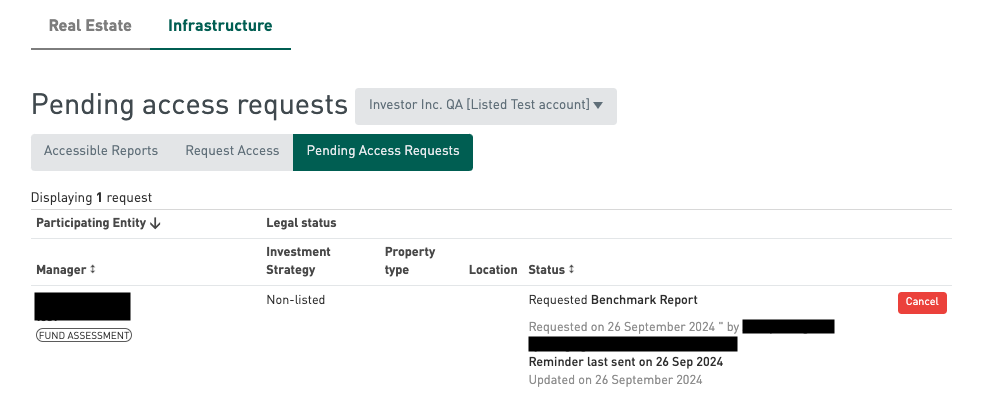
-
The entities will be notified by email once a request has been made. Our system generates a reminder email every two weeks in case the entity has neither granted nor declined access on the Portal.
If the request is time sensitive, we would suggest reaching out to the entity via your own channels and asking them to respond to your request on the GRESB Portal.
-
First-year participants can opt out of allowing GRESB Investors Members, or Fund Managers in the case of the Infrastructure Asset Assessment, to request access to their data and GRESB results. This is referred to as a ‘Grace Period’.
The Grace Period allows participants a year to familiarize themselves with the GRESB reporting and assessment process. The names of participating entities are still visible during the Grace Period, but GRESB Investor Members, and fund managers in the case of the Infrastructure Asset Assessment, will not be able to request to see their results.
-
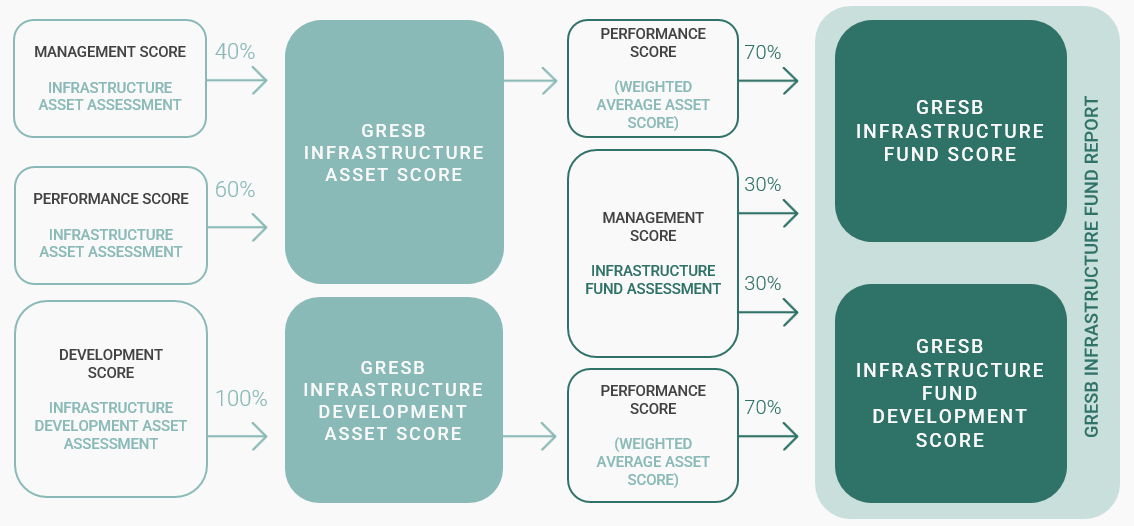
The Infrastructure Fund Assessment provides the basis for systematic reporting, objective scoring and peer benchmarking of the ESG management and performance of infrastructure funds around the world. It includes a Management Component, which is aligned with the Management Component in the Infrastructure Asset Assessment.
The other component is the Performance Component. A fund’s underlying assets may participate in a complementary Infrastructure Asset Assessment, with these scores informing the fund’s Performance Component Score. While the participation of underlying assets is not required, only funds with at least 25% of assets participating will receive an overall GRESB Score and be allocated to a corresponding peer group.
For the Infrastructure Asset Assessment, both single and multi-asset operators can participate. It is structured into separate Management and Performance Components. The Infrastructure Development Asset Assessment, which launches in 2024, supplements GRESB’s existing fund and operational asset assessments, focusing on greenfield development and pre-operational assets. It is a single assessment, with a number of indicators focused on ESG management practices and performance.
The below diagram shows the different Infrastructure Assessments interacts with each other:
-
The Data Exporter allows users to download all the reported data points in the Assessment per accessible entity in bulk. You can find the right variables for your analyses with our search and filter functions.
If you would like to compare the aggregated performance of your portfolio against a benchmark of your choice, the Portfolio Analysis Tool is the ideal tool to do so. Users can define the benchmark based on different criteria drawn from our entire participant universe for a useful analysis. For example, if you want to benchmark your portfolio against all European industrial entities, it is possible to do so.
-
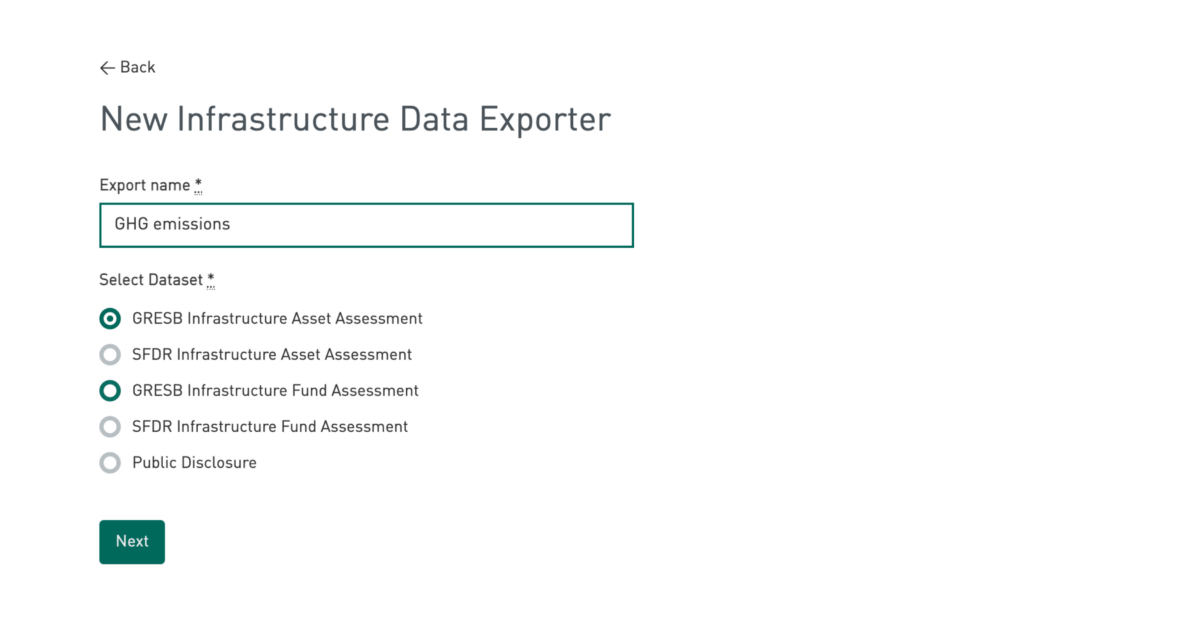
You may use the Data Exporter to download the relevant data to facilitate your own analyses.
After clicking on ‘Create a new data export’ and choosing ‘GRESB Infrastructure Fund Assessment’, you can select the desired variables with our search function.
By using the search function, the scope will be narrowed down from thousands of variables to only a hundred, and you will be able to see the relevant variables with descriptions.
You can check the box in the top row to select all the relevant variables or select them individually. Please choose the desired format (i.e. CSV or Excel) and accept the terms and conditions for a successful download.
Below is an example of how the export will be displayed in an Excel format.
-
You may use the Data Exporter to download the relevant data to facilitate your own analyses.
Similar to the last example, please choose ‘GRESB Infrastructure Asset Assessment’ instead.
Then, with the help of search function, you may select from the following variables related to GHG emissions intensity.
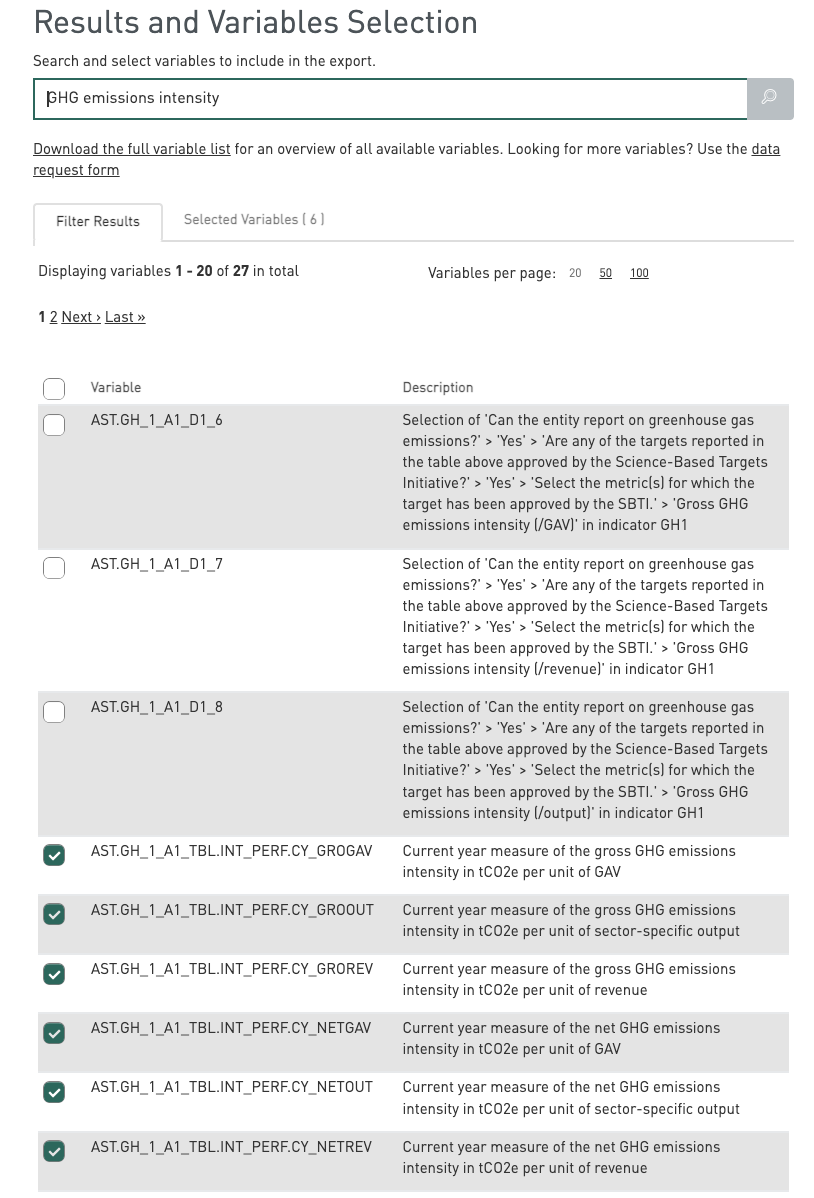
Please note that by ‘current year’, we are referring to the reporting year which is always one year prior. So for the 2024 Assessment, the reporting year is 2023, either fiscal or calendar year. Entities can choose either one of them.
-
You can use the Portfolio Analysis Tool to make such an analysis.
Choose ‘Fund’, name your analysis and click ‘Create’.
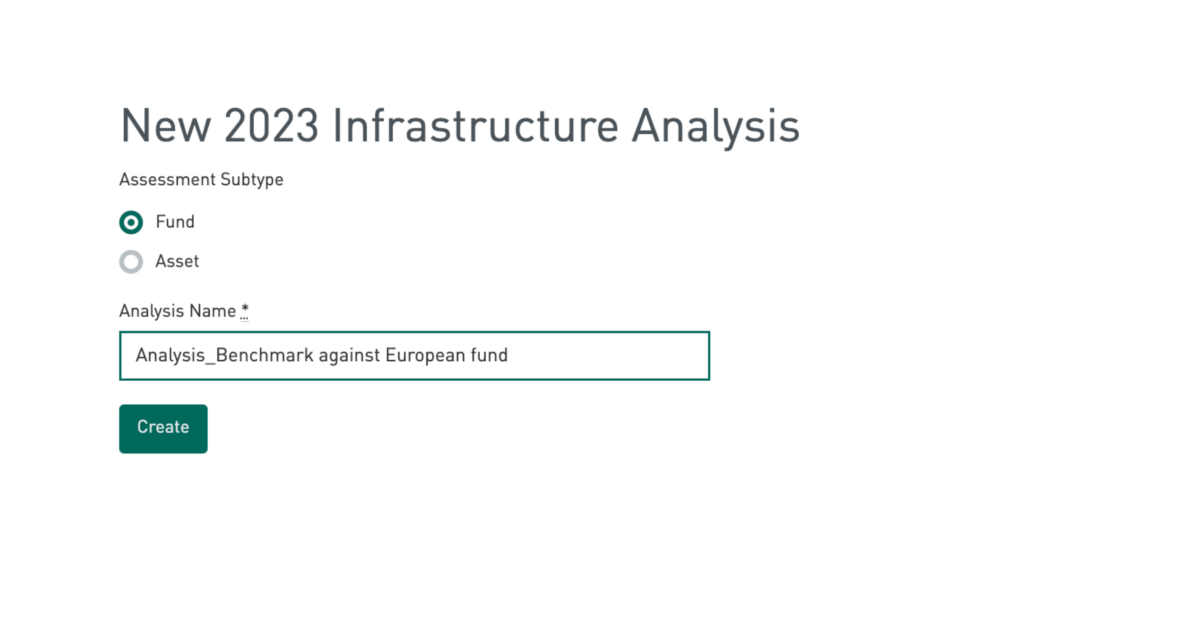
Since you would like to see the performance of the funds that have assets reported to GRESB as well, please select ‘Management and Performance Components’.
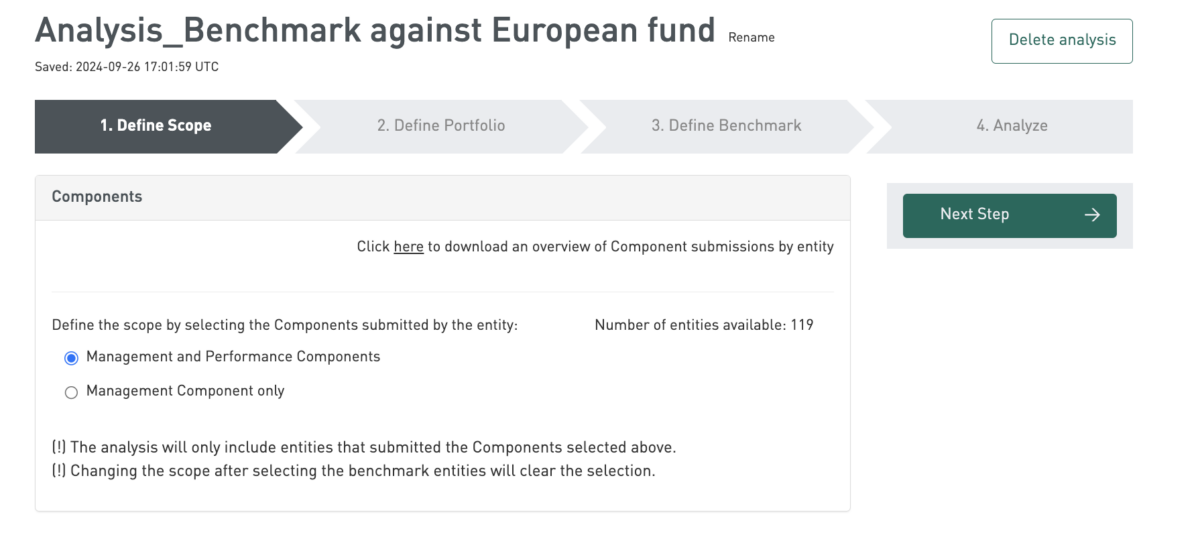
You can directly select the European renewable power funds using the search function, or you can filter the results to find them. Note that the display only shows the entities that you have access to.
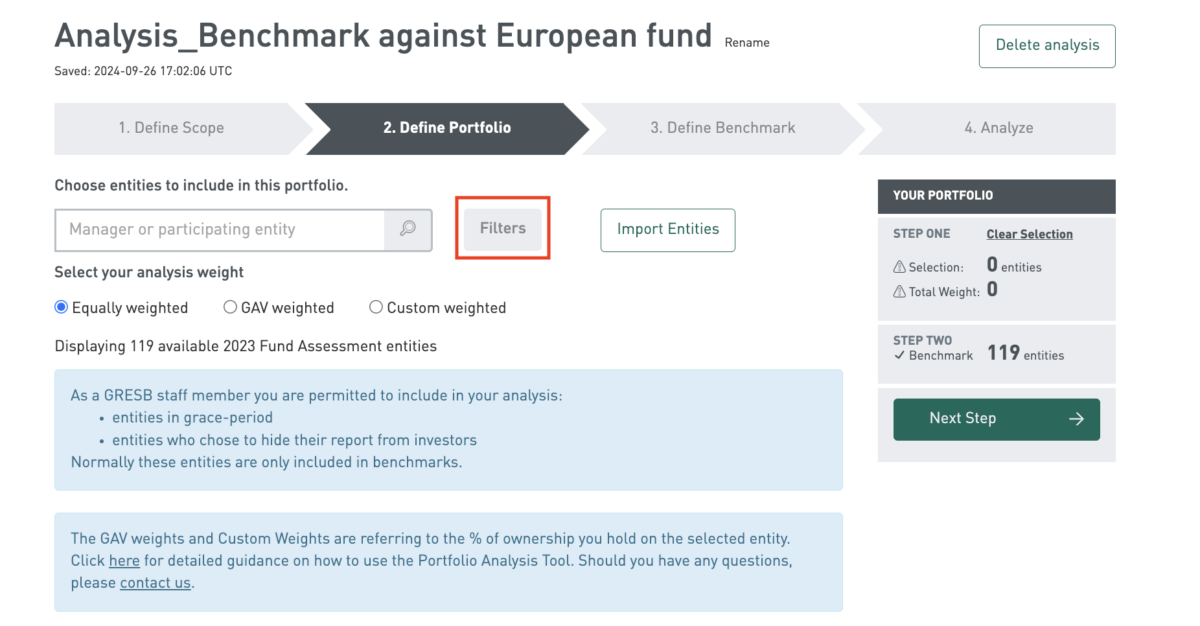
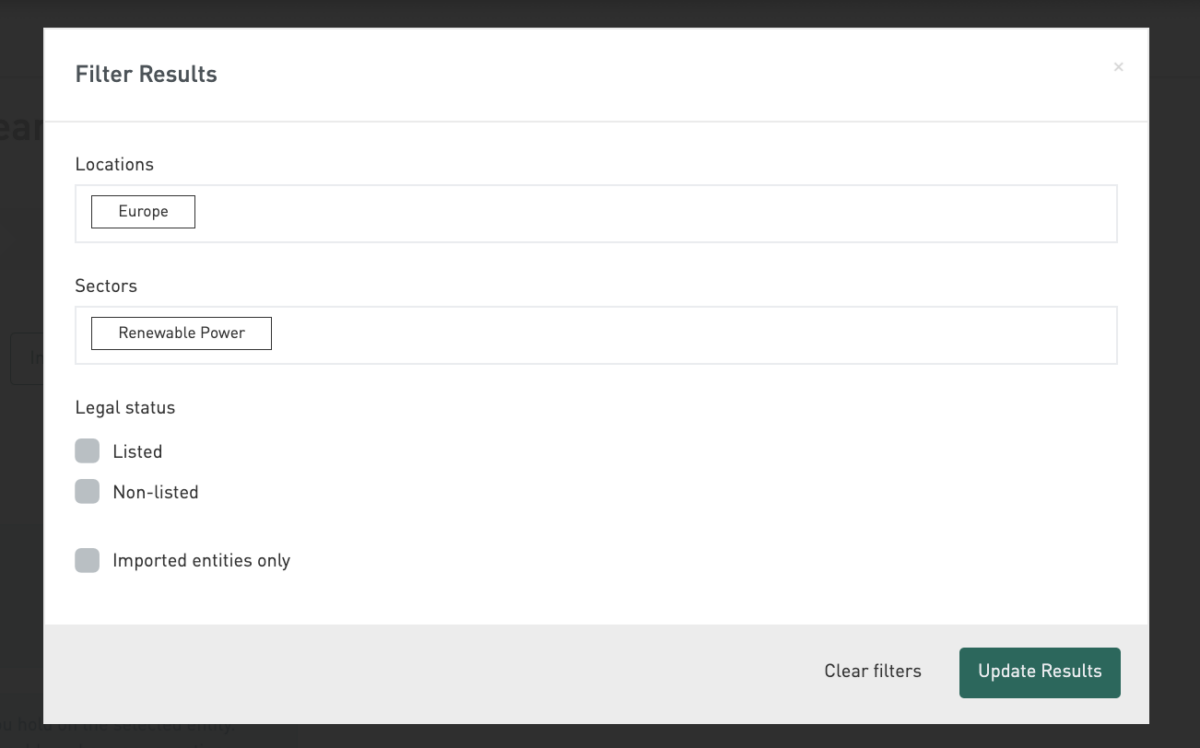
After applying the filter, you can see that the list of relevant entities is narrowed down. Then, please select the relevant entities to compose your portfolio by checking the boxes next to the entities.
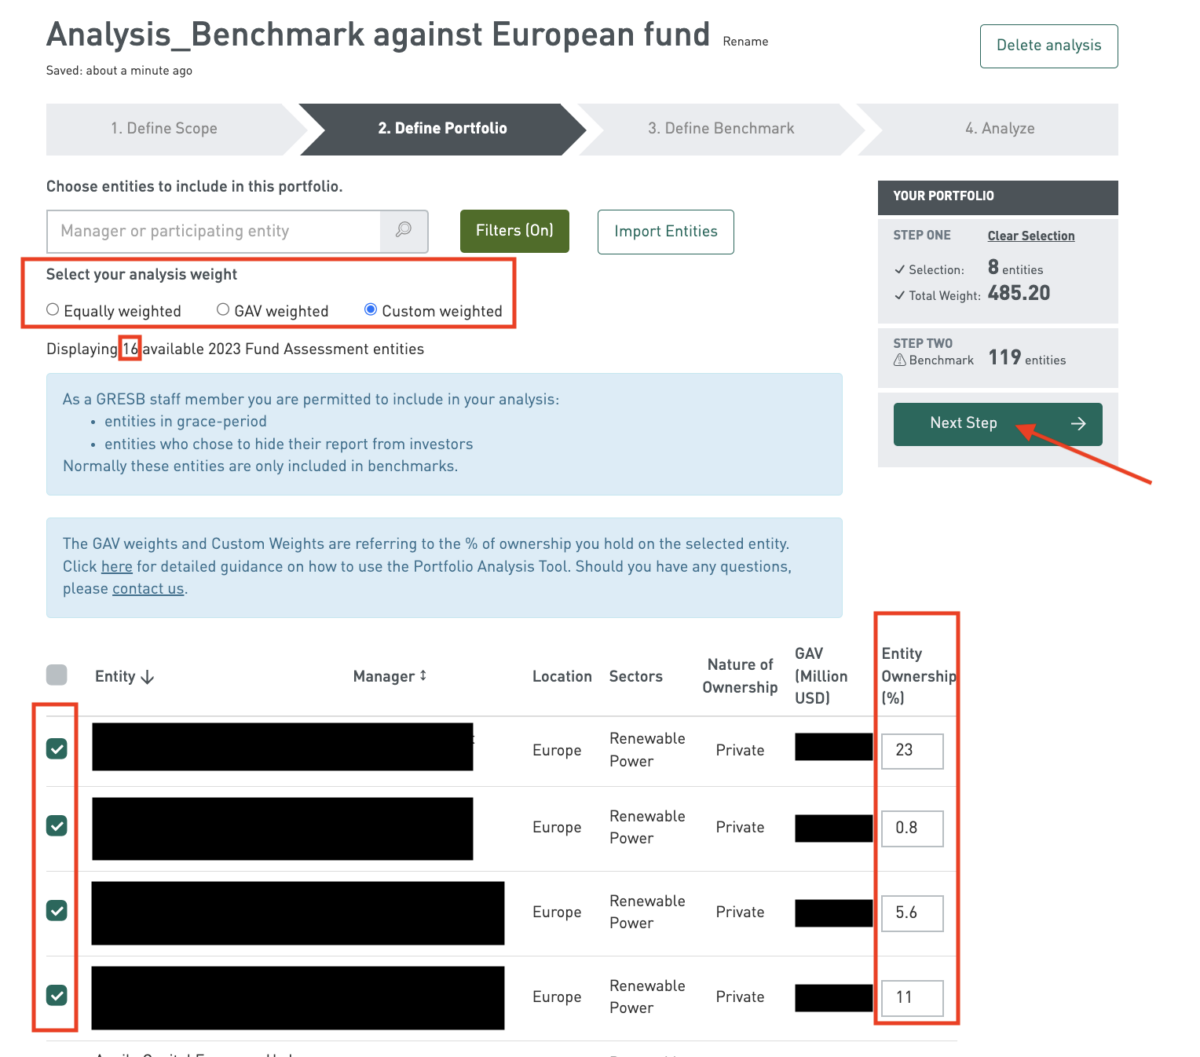
Now, you must assign a weight for the analysis. Different weighting options have the following impact on the aggregation:
- GAV weighted:
Scores and other percentage metrics (e.g. Data Coverage, etc.) are aggregated as the weighted average of the individual metrics of the Portfolio’s constituents, using their GAV as weighting factor.Absolute performance metrics (e.g. Energy Consumption, GHG Emissions, etc.) are aggregated as the sum of all constituents in the Portfolio. - Equally weighted:
This option only applies to Scores. Each entity’s score carries the same weight in the aggregated Portfolio Score. If this option is selected, the performance metrics of the analysis (i.e. the Portfolio Impact section) will not be displayed. - Custom weighted:
The values of the percentage custom weights will be divided by the GAV of the respective entity (expressed in USD) to determine the Weight used in the aggregation of absolute performance metrics in the Portfolio Impact section (e.g. total energy consumption, total GHG emissions of the Portfolio). The scores and other performance metrics, such as data coverage, are aggregated using a weighted average of the assigned Weights.
Note that if custom weighted is selected, it is mandatory to put down entity’s ownership (%).
Click ‘Next Step’ to proceed after confirming the selection and the total weights.
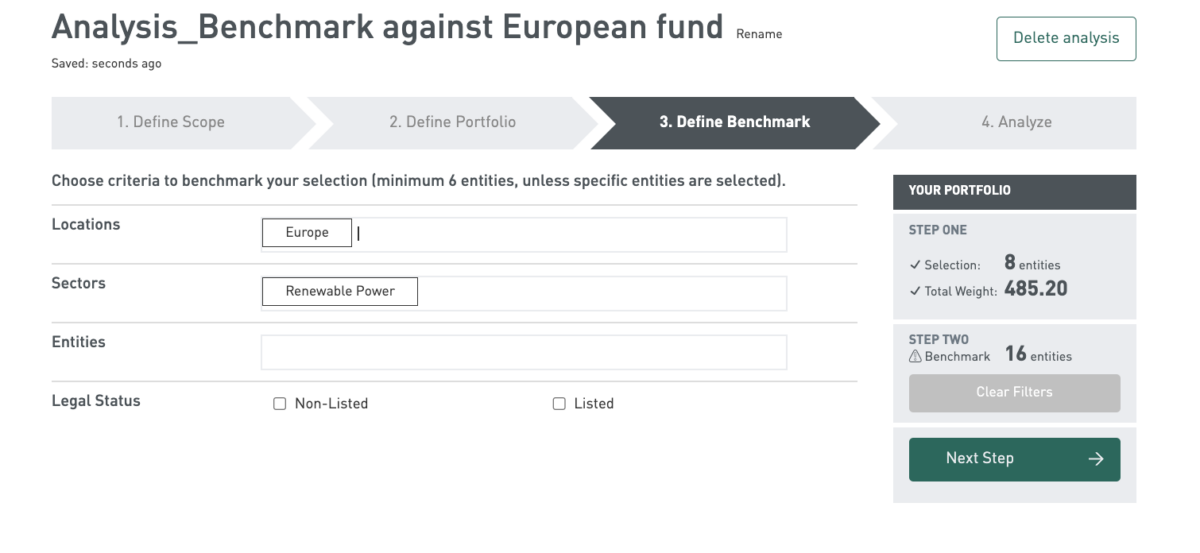
When defining the Benchmark, there are different criteria available. In this example, you should choose all of ‘Europe’ and ‘Renewable Power’ under the ‘Location’ and ‘Sectors’ criteria respectively. It shows that your portfolio of 4 funds will be benchmarked against 16 entities in this Benchmark.
Click ‘Next Step’ to generate the analysis.
Finally, you will be able to see the analysis as below. Note that the screenshot below only shows the top part of a regular Portfolio Analysis report. Scroll down in your own report for more granular insights.
- GAV weighted:
Get more from your GRESB data
As a GRESB Investor Member, you have access to a full range of data and analytics that can unlock a new level of insights into your investments. You can dive into Benchmark Reports, understand your real estate portfolio’s carbon footprint, analyze your portfolio in flexible ways, and export the data for additional analysis and modeling.
BENCHMARK REPORTS
Gain a detailed comparison of your investment’s ESG performance against peers, helping you identify strengths, areas for improvement, and manage risks. Use it to enhance decision-making and improve long-term returns.
PORTFOLIO ANALYSIS TOOL
Benchmark the ESG performance of your portfolios, providing insights into environmental impact, strategy alignment, and overall efficiency. By comparing portfolios against custom benchmarks, you can identify top performers, address underperformers, and enhance ESG reporting and stakeholder communication.
DATA EXPORTER
Easily export data from GRESB Assessments in .csv or .xlsx formats for custom analysis and modeling. Access specific data points, filter by variables, and perform time-series analysis to gain deeper insights into your ESG performance.
CARBON FOOTPRINT DASHBOARD
Gain a clear view of your GRESB real estate portfolio’s energy use and greenhouse gas emissions. Understand its environmental impact and discover insights to guide smarter decisions for your investments and the planet.
Looking to increase your ESG data coverage?
GRESB ESG data and benchmarks cover more than 2,200 real estate funds and 880 infrastructure funds and assets.
From the GRESB Portal, investors can:
- Track the reporting progress of GRESB participating entities
- Contact account managers tied to funds and entities
- Request access to the ESG data of any GRESB Participant
Ask your managers to participate
By encouraging your managers to participate in GRESB, you will be able to maximize your portfolio coverage for ESG data, drawing more meaningful benchmark comparisons and portfolio insights. You can share this webpage with your managers to help them understand why you want them to participate in GRESB.
You can also send a customized letter to your managers requesting participation in the GRESB Assessments.
Engagement timeline
| Assessment Development | JANUARY | Standards and Reference Guides pre-releases |
| Investors can review the 2023 Assessment Participants to calculate portfolio coverage before contacting managers to request participation in the 2024 Assessment. | ||
| Assessment Reporting Period | APRIL | April 1: GRESB Portal opens for the 2024 GRESB Assessments. Investors can use the “Invite” feature in the GRESB Portal to contact managers and prompt participation. The Response Tracker enables you to track the reporting progress. |
| Pre-Submission Checks (formerly Response Checks) can be requested from April 1 until June 7. | ||
| MAY | Pre-Submission Checks | |
| JUNE | Pre-Submission Checks can be performed until June 26 | |
| Validation, Scoring and Benchmarking | JULY | July 1: GRESB Assessment Portal closes on July 1, 23:59 PDT. This is the submission deadline for the 2024 Assessments |
| AUGUST | Validation starts | |
| Scoring and benchmarking | ||
| August 1-15: "Customize Peer Group" functionality available to real estate participants | ||
| Assessment Results | SEPTEMBER | September 2: Launch of preliminary 2024 Real Estate and Infrastructure Assessment results for Participants only |
| September 2-15: Assessment Correction (formerly Review Period) | ||
| Consultation Period | OCTOBER | October 1: Launch of 2024 Infrastructure Assessment results for Participants and Investors. October 10: Launch of 2024 Real Estate Assessment results for Participants and Investors. Results available in the GRESB Portal. |
| October 1: Results Consultation (formerly Results Review) can be requested until January 15. |
||
| Public results events | ||
| NOVEMBER | Public results events | |
| DECEMBER | Public results events |
Not a GRESB member?
Learn about becoming a GRESB Investor Member, read case studies or talk to us.