Our industry is engaged in an important dialogue to improve sustainability through ESG transparency and industry collaboration. This article is a contribution to this larger conversation and does not necessarily reflect GRESB’s position.
The role of data, coverage, and estimation in decarbonizing real estate
Data is the foundation of transparency and action towards decarbonization. Without an accurate assessment of how much energy a building consumes — where, when, and for what — planning capital projects for decarbonization will yield waste and misdirected expenses and efforts. However, though this statement may seem obvious, our experience at arbnco has revealed that most property owners and managers on the cutting edge of the transition to carbon-free operations struggle with patchy data availability, poor data quality, and inefficient manual data management processes. The bad news is that these are ubiquitous issues. It is easy to get discouraged, even cynical, about improving data coverage and quality. The good news is that real world organizations have faced these challenges and have made dramatic improvements. This transformation requires, in part, data coverage myth-busting. A discussion about data coverage may not be ‘fun,’ but there are more reasons for optimism than many may believe.
Myth 1: The data just isn’t there
The decarbonization of real estate is not proceeding nearly as efficiently or rapidly as it could or should be. It is frustrating that something as seemingly trivial of matter such as poor data (i.e., planners, owners, occupiers, and operators not having a handle on how energy is consumed in their buildings) can be one of the major impediments to rapid progress. While one can have an asset upgrade and maintenance plan without solid data coverage and energy analytics, what will be missed is a holistic, real-world view on how the performance of one or more buildings can move efficiently towards ambitious goals including net zero or 24/7 carbon-free operation.
The difficulty of obtaining data often creates an impression that accurate and useful energy data does not exist. Yet, the reality is that the data is there, if you invest in getting to it. Through the process of building more connectors and tools to utilities and other data providers, it is abundantly clear that automation and clever algorithms are of substantial benefit, making it faster and easier to collect and manage ‘missing’ data.
Automation has the power to increase coverage without a corresponding increase in manual effort, evidenced by the success of British companies with their 2023 GRESB submissions. They applied new best practices and tools to dramatically improve their data coverage, while reducing the typical impact of an annual scramble for data. This was true even of managers operating large and geographically diverse portfolios. Best of all, an initial investment with arbnco can increase coverage from 30-40% with manual methods to 80-100% with automation. After such an increase, there is little reason to return to the old way of doing things.
Myth 2: Accurate reporting requires 100 percent data coverage
GRESB has catalyzed a process encouraging energy consumption reporting transparency in the real estate sector over the last decade. We will consider the implications of data coverage for the most common use case in GRESB: estimating the average emissions intensity of a commercial real estate portfolio (e.g., the average metric tons of CO2 equivalent per square meter).
We examined four anonymized real estate portfolios (referred to as portfolios 1–4) from the GRESB submission database, experimenting with statistical sampling to demonstrate how partial data coverage affects the accuracy of estimating building/portfolio performance. The original population data for each portfolio is wide and exponentially distributed (e.g., portfolio 4 in Figure 1). In other words, more buildings have lower annual energy consumption while fewer buildings consume a lot of energy, with the range of consumption per building within one portfolio being wide.
Using truly random samples as evidenced in Figure 2, the average error reduces rapidly to zero. If we take enough random samples from the whole population (200 in this case, and calculate a statistic on each sample, e.g., the mean or sum of consumption, we can calculate the mean and standard deviation of the means. As illustrated by Figure 2, the mean of whichever statistic we calculate on those individual samples, even without any sample having knowledge of another, approximates the true value of the population statistic we are trying to calculate (e.g., sum of consumption for the population). The error ranges (1 and 2 sigma bands) shrink rapidly and 95% of the sample means and sums fall within ten percent of the true value with only half the assets included.
However, perfectly random sampling is challenging to achieve in the real world. Opportunities for bias and skew are ubiquitous, creeping in due to the influence of historic factors, building characteristics, local regulation, among other conflating variables. As we have interacted with clients, these problems manifest in several cases. For example, American states with benchmarking mandates make it easier to obtain energy data, so buildings such states are more likely to form part of a sample.
We represented two common biases in sampling with examples, either beginning with the smallest energy consumers first (as seen in Figure 3) or the largest (as seen in Figure 4). The errors in these cases are significantly larger on average and the chance of a specific sample being accurate are comparatively slim. Our simulations illustrate that biased sampling can shift the coverage required to achieve a reasonable error from less than 30% to nearly 80%. This dramatic increase in error is not uncommon in the real world, since biases are not uncommon.
It is worth noting that increasing coverage from 80% to 100% yields negligible changes in estimates for the average intensity or total emissions. This indicates that the largest return in new data acquisition tools is moving coverage from the 30-50% range to 80%. The bottom line is that although achieving 100% coverage is necessary for comprehensive analysis and action, reducing bias in sampling can accurately estimate key performance indicators without 100% data coverage.
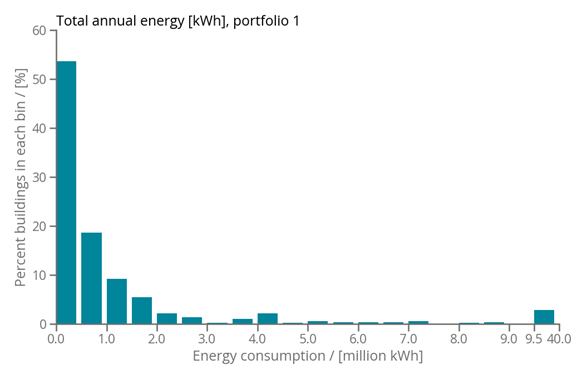
Figure 1: Distribution of energy usage for portfolio.
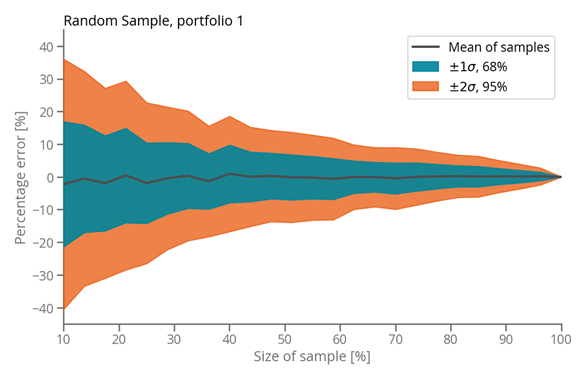
Figure 2: Unbiased, random sampling across all buildings.
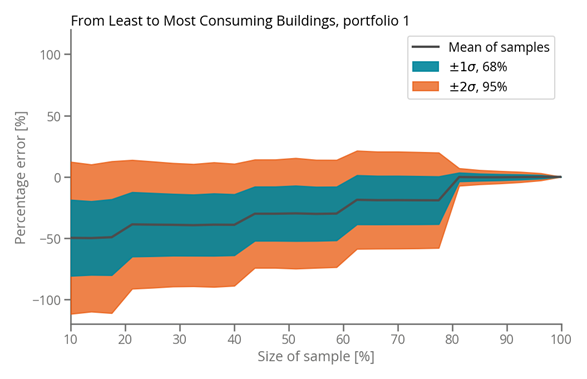
Figure 3: Biased sampling from least to most consuming buildings.
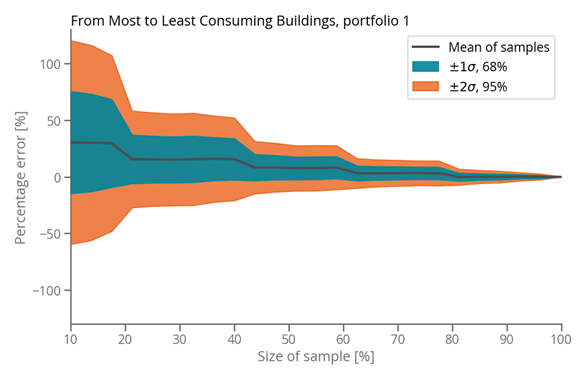
Figure 4: Biased sampling from most to least consuming buildings.
Conclusion
Simplifications like “more data is always better” is too vague to be useful. Data by itself does not guarantee or necessarily lead to better decision-making. However, planning is informed by good quality data about baselines, the relative importance of different sources of emissions, asset conditions, grid characteristics, weather data, and other indicators. Decisions made under with such data are more likely to be more robust than conventional approaches based purely on component or asset ratings. Robust data coverage is the best way to avoid obvious mistakes such as focusing too much on the wrong metrics (e.g., we ditched plastic straws but did not change our oil-based heating system) or mis-scoping (e.g. we drove down the Scope 1 emissions from our corporate office, ten percent of our total, at great cost, but neglected emissions from our tenants’ energy use, which constitute 80 percent of our total).
Our experience has shown us the data is almost always there, awaiting smarter data acquisition tools. The issue lies in how it is extracted and harmonized to extract meaningful intelligence in a cost-effective and repeatable manner.
A longer version of this article is available here, with more details and deeper discussions on each issue.
This article was written by Parag Rastogi, a research scientist and VP of Business Development at arbnco.
References
International Energy Agency (IAE), “Buildings”
Newcastle University, “Types of Sampling”
Institute for Market Transformation (IMT), “Map: U.S. City, County, and State Policies for Existing Buildings: Benchmarking, Transparency and Beyond,” (2023)