Sustainability data is no longer just a compliance tool—it’s a strategic imperative. In real estate, decisions around acquisitions, divestments, financing, capital planning, and investor engagement increasingly hinge on a portfolio’s operational performance and alignment with efficiency standards and climate goals. But internal metrics alone don’t tell the full story. Without benchmarks, it’s hard to know what “good” looks like.
That’s where GRESB’s REAL Benchmarks comes in.
Built on the world’s largest asset-level dataset for real estate sustainability performance—covering 500,000 investor-owned buildings across the globe and organized into 45 property types—REAL Benchmarks provides credible, market-aligned comparisons to inform faster, more confident decisions. And the best part: It doesn’t require participation in an assessment. There’s no scoring, no disclosure, and no added reporting.
So how are your peers using REAL Benchmarks? From evaluating risk and highlighting performance to sharpening decision-making across the portfolio lifecycle, here are six practical examples of how the platform could support your day-to-day work.
1. Filling data gaps to enable portfolio-wide analysis
Many funds face inconsistent or incomplete sustainability data across their holdings—especially in portfolios assembled through acquisitions or managed across regions. This limits the ability to make portfolio-wide decisions quickly.
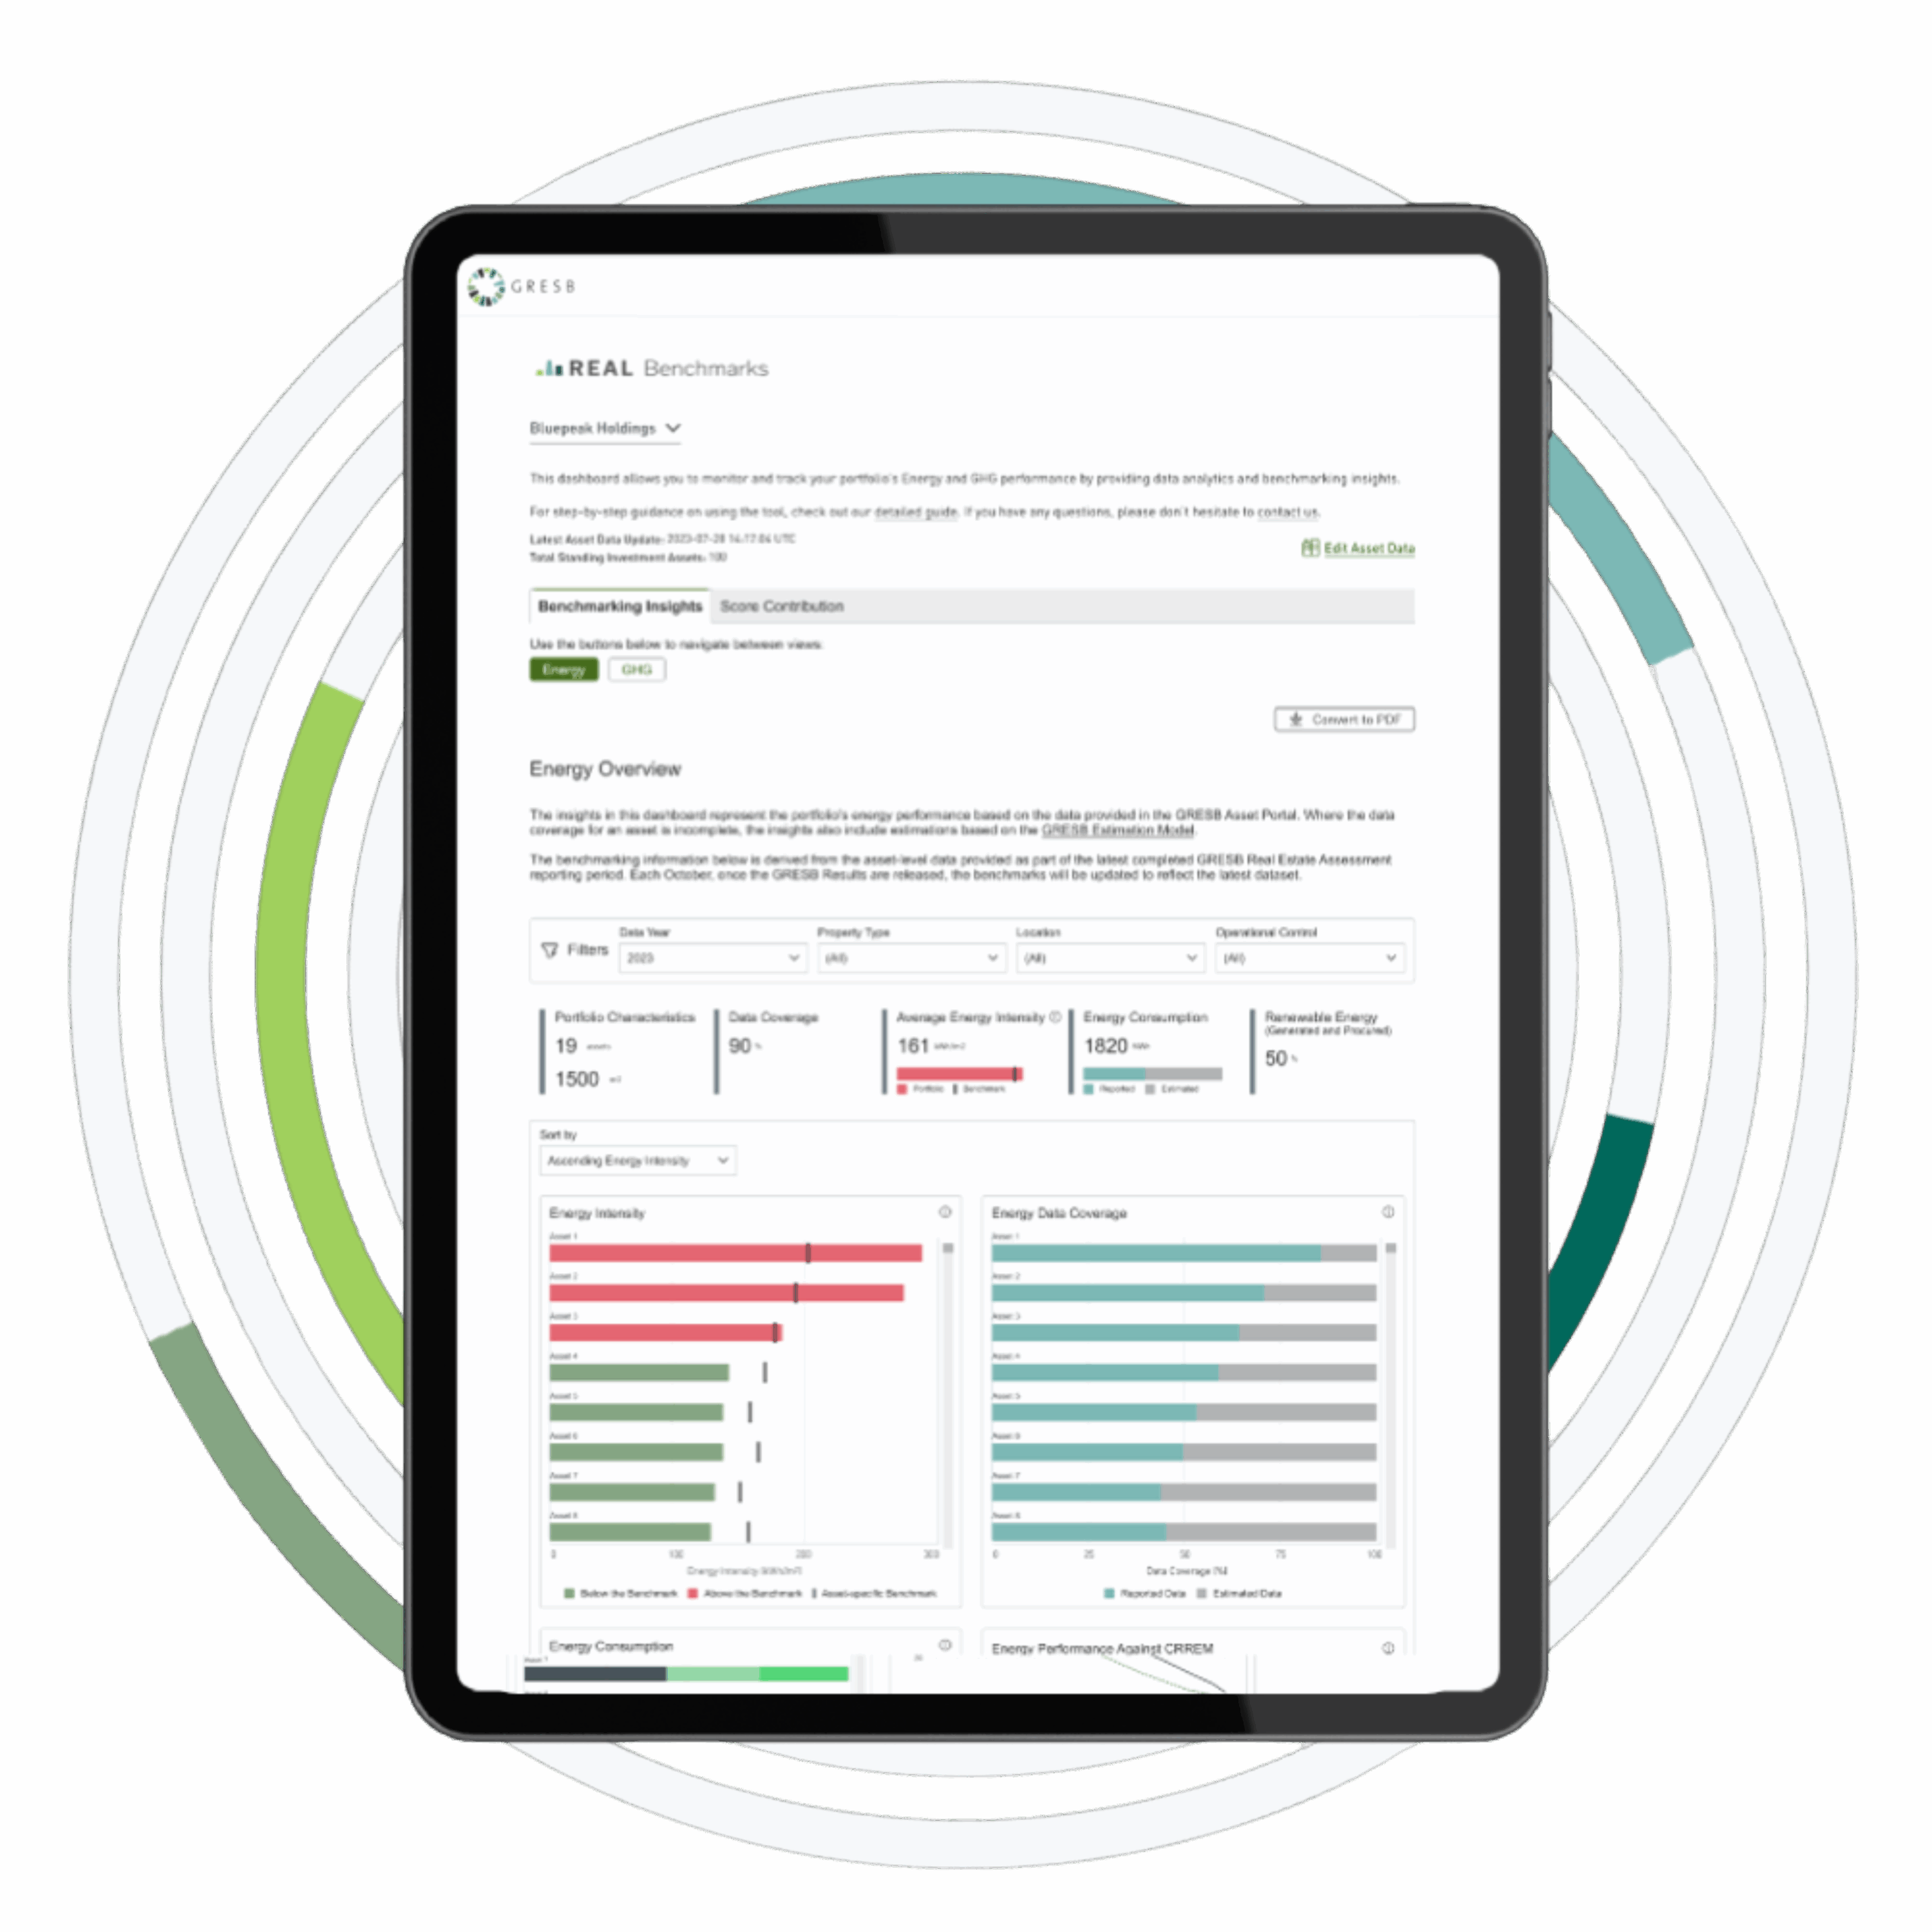
REAL Benchmarks includes an integrated Estimation Model that fills performance gaps using market-validated methodologies. A manager could generate credible proxy data for assets with missing utility records, building a consistent view of energy intensity or emissions exposure across the full portfolio

2. Identifying underperformers before the market does
A real estate office fund in Europe evaluating asset performance across its office holdings might want to go beyond internal tracking to understand where outliers exist. Some buildings may appear average in isolation but could lag significantly compared to regional peers in its specific property subtype.
With REAL Benchmarks, the fund team could compare each asset against any number of useful benchmarks built from more than 5,000 office-based assets in the same market, identifying which fall below the 50th or 25th percentile on energy intensity or emissions. This would enable a proactive discussion about retrofit priorities and risk exposure—well before investors or tenants begin to ask tough questions.

3. Supporting refinancing with CRREM alignment
A portfolio manager preparing for refinancing might need to demonstrate how key assets align with the latest CRREM decarbonization pathways. Rather than spending hours filling in additional spreadsheets, they could use REAL Benchmarks to see how their buildings compare to regional performance norms in real time—and how far they are from target trajectories.
The analysis could highlight which assets are already aligned, which face potential transition misalignment risk, and where incremental improvements would yield the greatest transition risk reduction.

4. Highlighting green premiums in investor updates
An institutional investor in North America preparing an annual performance report may want to feature high-performing residential assets and demonstrate that sustainability efforts are translating into tangible value. But without context, internal performance data can’t always prove market leadership.
By benchmarking its residential assets against 30,000+ residential assets in North America, the team could identify properties in the top quartile for energy efficiency—and cross-reference those with strong NOI growth, occupancy rates, or rent premiums.
5. Entering a new market with local intelligence
A U.S.-based firm looking to expand into Asia-Pacific markets might want to understand typical performance standards for industrial buildings. Without this context, it’s difficult to underwrite retrofits, estimate transition risk, or anticipate tenant expectations.
REAL Benchmarks provides data from 3,000+ APAC-based industrial assets, offering local performance curves by property subtype and country. This would help an acquisitions team understand what “efficient” looks like in a given market—and where a target asset sits in the distribution.
6. Stress testing ahead of GRESB participation
A mid-cap manager exploring GRESB participation might want a sense of where their assets sit relative to peers—before entering the formal assessment process.
REAL Benchmarks could provide a preview, showing how their portfolio compares to medians in relevant sectors and geographies. The team could identify improvement areas, plan early interventions, and prepare a narrative for investors or internal stakeholders.
Why it matters
REAL Benchmarks gives investment teams a new layer of visibility: trusted, asset-level performance context that supports day-to-day decisions—not just annual disclosures.
With it, teams can:
- Validate internal data and catch performance gaps early
- Contextualize risk across regions, property types, and asset classes
- Prioritize capital improvements based on real market distributions
- Support engagement with lenders, investors, and acquisitions teams
- Enhance transparency without added reporting burden
Whether your focus is on improving fund performance, reducing exposure to transition risk, or preparing for future reporting, REAL Benchmarks offers a flexible, frictionless way to bring strategic intelligence into your process.
Next step: See how you stack up
Request a Portfolio Preview—a tailored look at how your assets compare to the world’s largest dataset for real estate sustainability performance.
- No reporting required
- No disclosure
- Just fast, independent insight