Dashboard guidance
Listed and non-listed real estate investors can access the Carbon Footprint Dashboard via the GRESB Portal. Once logged in, navigate to “Carbon Footprint” in the panel on the right-hand side.
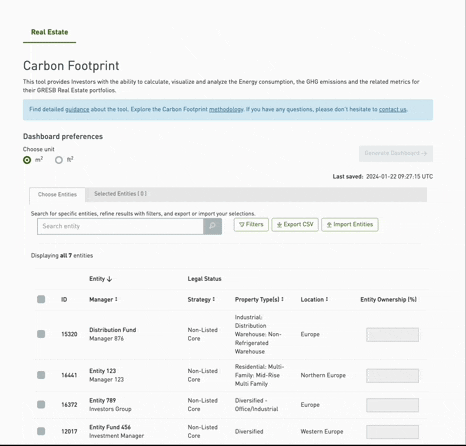
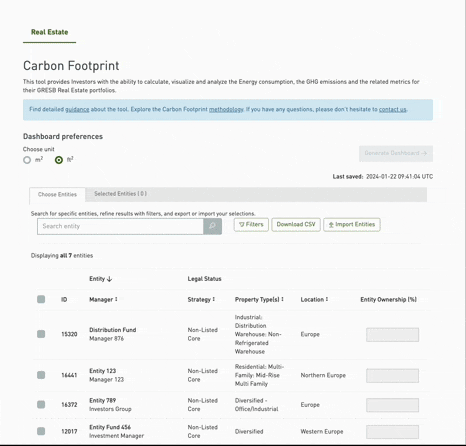
To input information and generate a dashboard, please follow the steps below:
- Choose your preferred unit of measurement for area (m2 or ft2)
- Select the entities you wish to include in the calculation from the list of entities to which you have access
Entity selection can be done in 2 different ways:
- Manual selection can be carried out by either searching for specific entities using their names directly orby using filters for locations, property types, legal status, and investment strategy (available only for non-listed funds). In order to select the entities, please check the box next to them and fill out the entity ownership % (the value should be between 0 and 100)
- Alternatively, you can import entities by first exporting the list of entities to which you have access in CSV format and filling out the percentage of ownership for the entities you wish to include. Delete the entities that you wish to exclude from the calculation, save the file, and then upload it to the Portal. The content will be reflected on the Dashboard once the file has been successfully uploaded
You can view the selected entities next to the “Choose Entities” tab. If you’d like to clear your selection, you can do so by clicking the “Remove All” button.
Next, click “Generate Dashboard.”
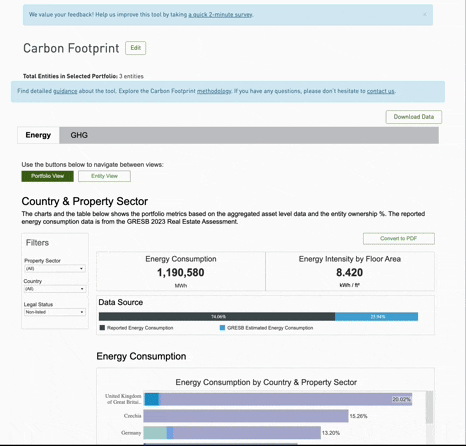
How to navigate the Dashboard
- For both Energy and GHG tabs, users will be able to navigate between portfolio and entity views using the corresponding buttons
- When looking at the portfolio view, users can visualize metrics by country and property sector
- Users can also use the filters to adjust and interact with the data
- Additionally, in the GHG tab, users have the option to choose between market-based and location-based emissions
- The data can be downloaded in Excel format according to the category (Energy or GHG) and view (portfolio or entity view)
- Users are also able to convert the charts and table to PDF
Watch a demo below
FAQs
-
GRESB Real Estate Investor Members (listed and/or non-listed) can access the Carbon Footprint Dashboard through the Portal. If you are interested in becoming a GRESB Investor Member, or you are an existing investor member but cannot access the Dashboard, please contact us at [email protected] or via our contact form.
-
Currently, the Carbon Footprint Dashboard is only available for GRESB Investor Members with a real estate subscription (listed/non-listed).
-
Yes, the Carbon Footprint Dashboard covers both listed and non-listed real estate entities. The type of entities available in the Dashboard is contingent on the subscription of your investor membership.
-
The carbon footprint of a portfolio is calculated for the Dashboard as follows:
- Extraction of the energy consumption data reported by entities submitted in the Performance component of the GRESB Real Estate Assessment
- Completion of the energy consumption data using GRESB’s Estimation Model
- Conversion of the energy consumption into GHG emissions
- Aggregation of the GHG emissions (in line with PCAF attribution methodology)
-
In cases where energy consumption data is missing, the GRESB Estimation Model can use a building’s known data points – such as floor size, location, and property subtype – to generate a highly representative estimation from a global database of approximately 170,000 real estate assets within the GRESB benchmark.
-
Using calculated GHG data enables GRESB to fill any data gaps and ensure 100% coverage, leveraging the GRESB Estimation Model. Using GHG data reported by participants in GRESB Real Estate Assessment would create inconsistencies with the rest of the GHG data, which is derived from the energy data of the asset in a standardized way.
Using calculated GHG data provides benefits including:
- Boosting the consistency of GHG data through the use of a robust set of emission factors
- Enhancing the consistency in the delineation of Scope 1, 2 & 3 emissions
- Increasing the comparability of GHG data across investor portfolios
-
GRESB Real Estate Investor Members (listed/non-listed) can generate a Carbon Footprint Dashboard for all entities which:
- Have granted the investor access to their Benchmark Report
- Have submitted the Performance Component of the 2023 GRESB Real Estate Assessment
- Data can be displayed in compliance with the terms & conditions
-
Yes, you can export the portfolio and entity (Energy & GHG) data in Excel format by using the “Download Data” button or a PDF version of the charts using the “Convert to PDF” button.
-
Investors using the Carbon Footprint Dashboard will be required to input their Entity Ownership % of each entity they would like to include in their portfolio for analysis. The Carbon Footprint Dashboard will consider the Entity Ownership %, along with the percentage the entity owns in each asset (taken from the GRESB Asset Portal) in the calculation of the investor’s share of energy consumption and GHG emissions.
This is in alignment with the Partnership for Carbon Accounting Financials’ (PCAF) attribution methodology. The GHG metrics on display are thus representative of the investor’s “financed emissions.”
-
Scope 3 emissions in the GRESB Assessment are calculated as the emissions associated with tenant areas, unless they are already reported as Scope 1 or Scope 2 emissions (if they cannot be disassociated from emissions from other areas). For the purposes of the GRESB Assessment, as well as for the calculation of financed emissions from real estate operations of investment portfolios, Scope 3 emissions refer only to emissions relating to the energy consumption of the building. They do not include emissions generated through other tenant-related emissions such as those by its employees, transmission and distribution losses, manufacturing loads (assuming they can be separated from building energy consumption), or upstream supply chain emissions.
-
Yes, the Carbon Footprint Dashboard calculates an investor’s share of energy consumption and GHG emissions using a methodology that is aligned with the Partnership for Carbon Accounting Financials’ (PCAF).
-
For the current version of Carbon Footprint Dashboard, GRESB Real Estate Investor Members can only generate one dashboard at a time. Previous versions of analysis generated will not be stored. Investors can export the data in Excel format or a PDF version of the charts, once they have generated the desired analysis.