The GRESB team has received extensive feedback that the current, sector-agnostic scoring model does not fully reflect the operating characteristics of industrial assets, which includes logistics and warehousing. Interviews and engagement with participants indicate a clear interest in incorporating sector-specific scoring and metrics.
This article presents alternative scoring methods for industrial assets, informed by a survey of managers active in the sector. The results of the survey presented here will help inform the broader evolution of the GRESB Assessments scheduled for implementation by 2028, subject to the approval of the Foundation Board.
Motivation
Real estate sectors differ substantially in materiality, data availability, and operating models. Lease structures, occupancy patterns, and operating control further affect data access and one’s ability to act.
Despite these differences, the GRESB Real Estate Assessment applies the same set of indicators—focused on management practices, performance metrics, and stakeholder engagement—across sectors. As industry feedback has highlighted, this uniform structure limits the relevance of benchmarking results for certain sectors like industrial.
As part of preparatory work leading up to a major revision of the GRESB Standards in 2028 (subject to Foundation Board approval in 2026), GRESB has been testing and refining three approaches for introducing sector-specific assessments:
- Residential Real Estate Assessment: A supplement to the general Real Estate Assessment that was introduced in 2024 with a small number of residential-specific indicators.
- Data Center Assessment: An entirely new assessment for data centers, launching in 2026, that shares most themes with the existing real estate and infrastructure assessments but creates new indicators specific to data centers.
- Sector-Specific Metrics, Indicators, and Scoring Weights: the approach is under active development, where the existing structure of the Real Estate Assessment is modified according to the consensus of sector priorities, materiality, and usage.
Potential Categories of Change
When looking at the third approach to introducing sector-specific assessments, GRESB has identified three types of possible changes to how the Real Estate Assessment is conducted.
- Assessment “Flavors” (scoring weight changes)
The weights, or number of points out of 100, assigned to each aspect (usually a topic like energy) or indicator (usually a metric like GHG data coverage) can be reassessed based on an emerging consensus of the relevance or materiality within the current Real Estate Assessment. This is a constrained version of the materiality-driven scoring available in the Infrastructure Assessment, in that all the topics currently covered by the Real Estate Assessment are included. The survey of industrial sector managers presented below tested this approach. - Materiality Assessment (indicator and weight changes)
The residential Real Estate Assessment uses an assortment of indicators from the general Real Estate Assessment. This principle could be extended to other sectors in the same way that the materiality matrix of the Infrastructure Assessment “chooses” indicators and their weights based on sector, size, etc. The difference from the first category is that this approach would involve choosing aspects (topics) and their importance based on entity characteristics and adjusting weights dynamically with the selected topics only. - Sector-Specific Metrics
The relevance of current and future performance metrics could be improved by offering comparable metrics that measure the same physical quantity but use more relevant contextual data. For example, energy used per unit area (energy use intensity or EUI) is the catch-all metric currently used to measure energy efficiency for all sectors. Other metrics may be more appropriate, such as energy use per person-night for hotels and student accommodation, energy use per person-hour for office and retail, or energy use per regular resident for residential.
Sector-Specific Pilot: Industrial
Industrial is a useful sector to look at, given its significant differences from others sectors within the GRESB Benchmark. For us, industrial comprises warehouses (refrigerated and non-refrigerated), manufacturing, industrial parks, and “others.” Under the current scoring model, industrial funds are under-represented in the four- and five-star categories, disproportionally more so than would be expected by design. Compare this to office or retail funds, which have disproportionately higher representation in the five-star category.
Table 1: Distribution of entities from each sector in each star category.
| Percent entities per sector in each star rating (%) |
| Sector / Ratings | ★ | ★ ★ | ★ ★ ★ | ★ ★ ★ ★ | ★ ★ ★ ★ ★ |
| Office | 12.9 | 14.9 | 17.5 | 23.2 | 31.5 |
| Retail | 20.8 | 16 | 14.1 | 17.7 | 31.4 |
| Other | 22.2 | 24.3 | 21.8 | 15.4 | 16.3 |
| Industrial | 27.6 | 23.7 | 20.6 | 15.1 | 13.1 |
| Residential | 30.6 | 21.3 | 20.2 | 16.3 | 11.5 |
| Diversified | 17.1 | 24.3 | 24.8 | 23.5 | 10.3 |
One of the highest point allocations in the Assessment is for Energy data coverage (8.5p). The highly correlated GHG data coverage takes this to 13.5p total. The industrial sector follows the same long-term pattern as the rest of the index (Figure 1), but with a gap of ~10% that persists across multiple years, meaning lower scores.
The story is similar across other indicators (Figure 2): the industrial sector has similar medians and variation compared to the max points for each aspect (collection of indicators) but it is always lower than the rest of the index.
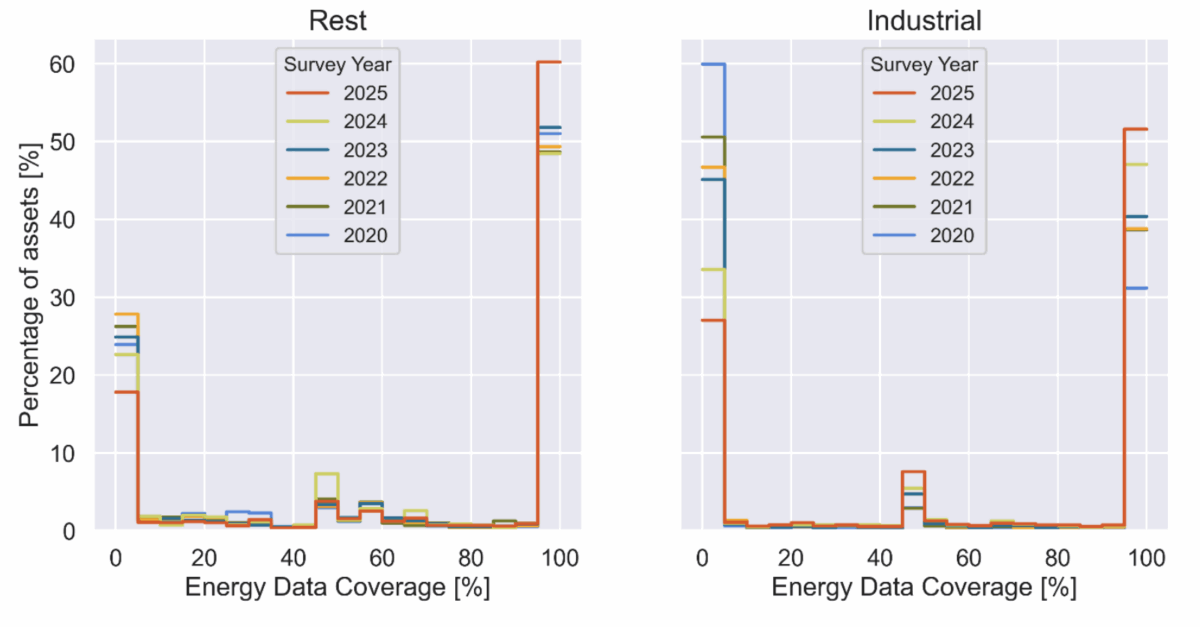
Figure 1: Comparison of data coverage between industrial sector assets and the rest.

![Figure 2: Comparing median scores between Industrial sector assets and the rest for each aspect [top] and the Building Certification indicators [bottom].](https://www.gresb.com/wp-content/uploads/2025/12/post-sector-specific-scoring-2-1200x592.png)
Figure 2: Comparing median scores between Industrial sector assets and the rest for each aspect [top] and the Building Certification indicators [bottom].
Results from a 2025 Member Survey
In 2025, GRESB surveyed managers who oversee substantial industrial and logistics assets globally to help identify potential changes we could make to scoring weights. We received responses from North America, Europe, and Australia. The survey included two tasks: ranking a predefined set of options (Figure 3) and creating a custom score by weighting indicators. Out of 17 total responses, 9 proposed custom weights while 7 focused on ranking the options.
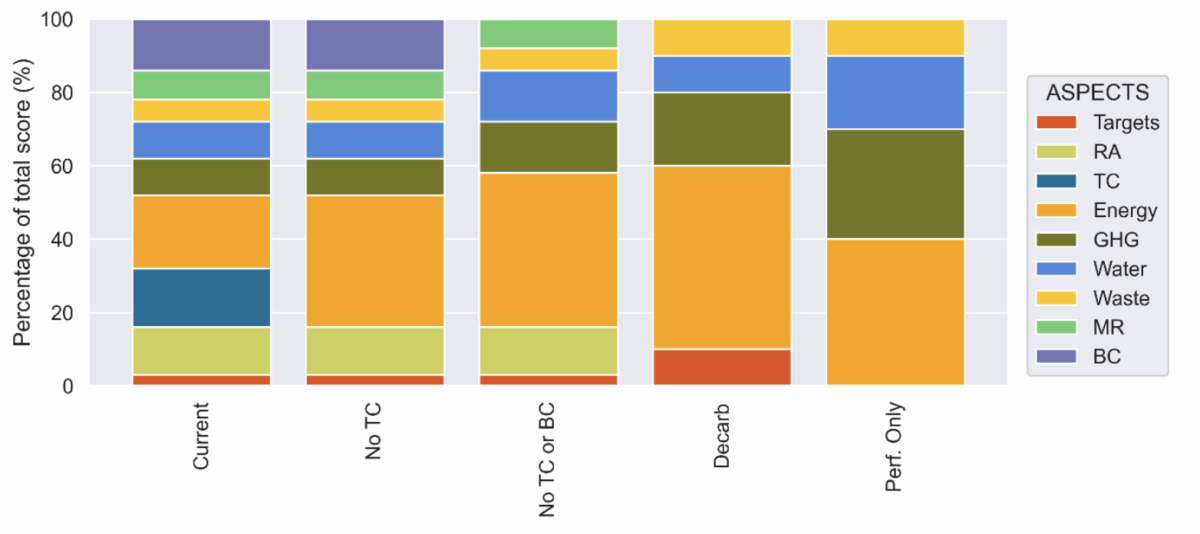
Figure 3: The five options for distributing weights among aspects presented to survey participants. From left to right, the options are increasingly simple but also more different than the current weighting scheme.
The predefined options presented alternate weighting schemes—ranging from making light changes like removing Tenants and Communities (TC) to removing all indicators except the four “measured” ones—Energy, GHG, Water, and Waste. These options were deliberately kept simple to allow for rapid prototyping and feedback. Respondents could also individually weight the aspects and indicators to create a new scoring system.
Survey Results
The survey yielded important insights and a viable path forward for incorporating sector specificity in the Real Estate Assessment. The principal results of the survey are discussed here, followed by a discussion of future work in the next section.
Of the respondents that ranked the preset options, the less disruptive options (remove TC or TC and BC) were favored over the more disruptive ones (Decarbonization, Performance Only).
The responses indicated a clear lack of preference for simply re-allocating weights within the existing Real Estate Assessment as a response to the issues faced by industrial assets and funds.
![Figure 4: Ranks (preferences) for the five options for distributing weights among aspects. [Left] Ranks per option: from rank 1 (red) to 5 (blue). The higher number of 1 and 2 ranks for “Current”, “No TC”, and “No TC or BC” are mirrored in the right hand side figure. [Right] Average (mean) rank for each option, showing that the average ranks for the first three options are lower (better) than those for the last two options.](https://www.gresb.com/wp-content/uploads/2025/12/post-sector-specific-scoring-4-1200x514.png)
Figure 4: Ranks (preferences) for the five options for distributing weights among aspects. [Left] Ranks per option: from rank 1 (red) to 5 (blue). The higher number of 1 and 2 ranks for “Current”, “No TC”, and “No TC or BC” are mirrored in the right hand side figure. [Right] Average (mean) rank for each option, showing that the average ranks for the first three options are lower (better) than those for the last two options.
Of the respondents that filled in custom weights for each aspect (Figure 5), most favored weighting Energy highest at about 40%. Most of the other aspects received 0–10% of the weight each, with few exceptions. Interviews with the participants revealed a preference for rethinking the calculation of the Energy indicator towards performance—including preferring energy efficiency (not necessarily measured as EUI), renewable (over-) production, and removal of onsite combustion—over data coverage and year-on-year improvement.
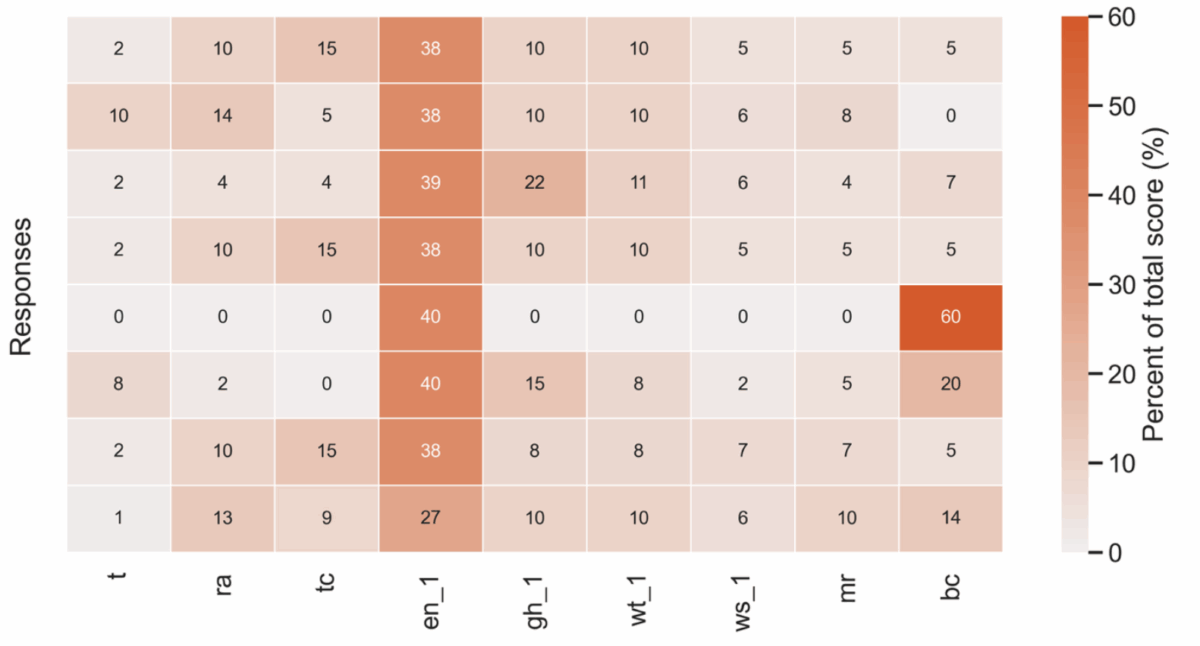
![Figure 5: Custom weights for each aspect as assigned by participants as a heat map [top] and bar graph with average and standard deviations [bottom]. Clearly the respondents agree on the need to weight Energy most heavily (about 40%) followed by GHG. The average for Building Certifications are skewed by one respondent favoring it heavily.](https://www.gresb.com/wp-content/uploads/2025/12/post-sector-specific-scoring-6-1200x598.png)
Figure 5: Custom weights for each aspect as assigned by participants as a heat map [top] and bar graph with average and standard deviations [bottom]. Clearly the respondents agree on the need to weight Energy most heavily (about 40%) followed by GHG. The average for Building Certifications are skewed by one respondent favoring it heavily.
Combining the results from the ranked options and custom weights above with interviews with industrial sector participants, we conclude that tweaking the existing weights while keeping the indicators unchanged is not preferred as a way forward. Even if consensus is achieved on weights, there is no guarantee that the resulting consensus will be stable and generalizable.
Conclusion
The exercise described a possible approach to creating a consensus-based materiality weighting of topics (aspects) within the existing structure of the Real Estate Assessment. It is one of three ways that the GRESB team are looking at reinforcing sector-specificity in the Real Estate Assessment, building on the Residential and Data Center Assessments.
The advantages of reforming the Real Estate Assessment to better account for sector-specific metrics, topics, and relevance (materiality) include:
- Better representation of risk and sustainability priorities in data and scores
- Better interpretation of existing data and opportunities for efficiency in data collection
A possible downside of this approach is that comparability across sectors is more nuanced, though feedback from participants and investors indicates a general acceptance of trade-offs.
The opinion of industrial-sector respondents presented here mirrors the major reform of the Real Estate Assessment, which will be in public consultation starting February 2026 (Road to Performance), in its desire to emphasize performance, particularly that of energy and GHG. At the same time, participants do not want to necessarily reduce, remove, or increase weights on the other existing indicators such as Building Certifications to compensate. Participants highlighted issues for the industrial sector with how indicators are calculated, beyond simply the weight that they are allocated.
Future Work
The results from this consultation suggest that an approach consisting solely of tweaking weights within the existing Real Estate Assessment is insufficient to incorporate meaningful sector specificity. This work will be further refined in Q1–Q2 2026 to explore the other two approaches mentioned here (materiality assessments and sector-specific metrics) for industrial and other sectors. This will inform the major, substantive reform of the Real Estate Assessment that is currently under way.
Join us
Please join the public consultations due to be conducted from February to April 2026. This work will feature in it, alongside relevant complementary developments to create a relevant, tailored, informative Real Estate Assessment for the future.