Overview of Sections
Asset Consumption Metrics
Data coverage across energy, GHG, water, and waste continues to rise, reinforcing how managers are building the foundation for performance improvement.
Energy data coverage has now exceeded the 75% threshold globally for the second consecutive year—a level the GRESB Foundation defines as sufficiently high to fairly represent the energy use intensity of a whole building. This milestone marks a key point of maturity for the industry and supports the transition from a focus on data coverage to measured performance.
Similarly, waste data coverage has reached an all-time high of 58%, signaling market readiness for more robust evaluation. While waste diversion improved in 2025, waste to landfill remains a major source of carbon emissions for the real estate sector. With this strong baseline in place, the GRESB Foundation will aim to support clearer connections between waste management practices and emissions outcomes to help reward best practices in reduction, diversion, and circularity.
Asset Average GHG & Energy Intensities
In 2025, the Retail sector recorded the highest average energy, reaching 214 kWh/m2, followed by the Office sector at 160.6 kWh/m2. Retail consistently ranked as the most energy-intensive sector across all regions, with Asia reporting the highest energy intensity (240.6 kWh/m2), followed by the Americas (235.1 kWh/m2), Oceania (233.0 kWh/m2) and Europe (158.0 kWh/m2).
Similarly, the Retail sector also recorded the highest GHG intensity globally at 58.4 kg/m2, followed by Office (43.9 kg/m2), Residential (25.2 kg/m2), and Industrial (21.1 kg/m2).
Energy Efficiency
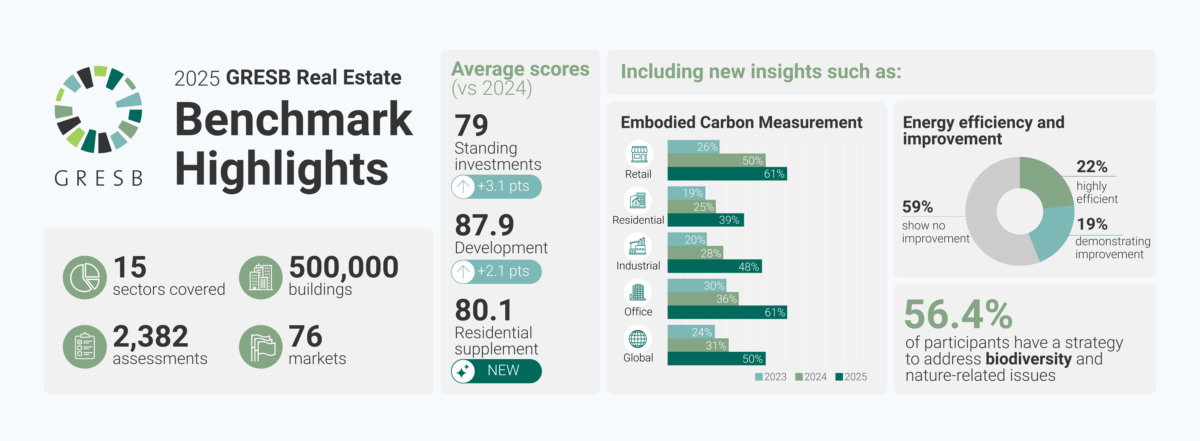
In 2025, 22% of assets reporting to GRESB are considered highly energy efficient. The chart above highlights the average energy efficiency for GRESB’s five largest sectors against ASHRAE Standard 100—the most comprehensive, data-driven engineering standard available for this purpose today. Operational assets are included if they meet the following criteria: a full year of data availability, a vacancy rate below 20%, a minimum of 75% data coverage, and an available ASHRAE EUI threshold.
To assess the sector’s energy efficiency performance, energy intensity is compared against the corresponding ASHRAE EUI threshold. Assets with an energy intensity below this benchmark threshold are considered highly energy efficient.
In 2025, the Healthcare sector showed the highest energy efficiency for all regions, with an average energy intensity 21.2% below the ASHRAE EUI threshold.
CRREM Across Regions and Key Markets
Derived from GRESB’s Transition Risk Report, the graph above showcases the aggregated floor area and GHG intensity of all operational assets reported to GRESB against their respective CRREM pathways at the regional and property-type level. In cases where energy consumption data was unavailable, GRESB’s Estimation Model and GHG calculation methodology were used to fill the gaps.
Net-Zero Progress
In 2025, the share of real estate entities with net-zero policies in place increased to 81.5%, up from 78.8% in 2024 and 72.4% in 2023. Conversely, the percentage of entities with net-zero commitments declined slightly, from an average of 59.6% in 2024 to 58.7% in 2025. This strong policy growth, paired with commitments leveling off, suggests that many managers are now shifting from ambition to implementation. This is further evidenced by the rise in targets, which reached 66.4%, up from 65.5% in 2024 and 50.4% in 2023—a 16-point jump in just two years.
Overall Participation
Despite significant market uncertainty, GRESB Members continued to demonstrate strong commitment to responsible investing in 2025—delivering robust insights and measurable progress across the real estate landscape. This year, 1,002 fund managers (including 84 new managers joining for the first time) submitted 2,382 assessments, including 239 entities participating in the inaugural Residential Component. (Note: the above graphic covers the main GRESB Real Estate Assessment.)
Market Headwinds and Deepening Commitments
Overall participation this year is in line with last year, with noticeable increases in markets such as Vietnam, Malaysia, Czechia, and Colombia. In several mature markets, we saw fewer fund originations and the winding down and consolidation of several established fund participants. GlobeScan’s recent report shows that perceptions of a “backlash” towards ESG have gained more traction in some regions than others.
For a detailed overview of how GRESB sees the market in 2025, please see the video “Challenge, Opportunity, and Growth: Reflections from the 2025 Benchmark” by Dr. Chris Pyke, GRESB’s Chief Innovation Officer, as part of GRESB’s Global Results 2025 program.
The GRESB Model
GRESB Scores provide a clear picture of the relative performance and risk of real estate assets by evaluating management practices (y-axis) and implementation performance (x-axis).
In recent years, this quadrant has become more densely populated, signaling positive progress in sustainability practices. In 2025, the GRESB Foundation identified the need for greater scoring differentiation among reporting portfolios as a key development priority for the Real Estate Standard—an essential step to recognize sustainability leadership. To support this, in 2025, the GRESB Foundation developed a set of significant methodological changes, which will be subject to a public consultation starting Q1 2026.
The GRESB Regional Model
Scores increased across the board in 2025, reflecting stronger management practices, deeper engagement, and measurable improvements in performance.
- Standing Investments average score rose to 79 (+3.1 vs. 2024)
- Development average score increased to 87.9 (+2.1 vs. 2024)
- Residential Component debut: average score of 80.1, outperforming residential participants in the main assessment
Looking closer at regional scores, we see a similar trend across both Standing Investments and Development. Oceania achieved the highest Standing Investments score at 83.3 (+3.4%), followed by Asia at 82.3 (+2.6%). On the Development side, Oceania led again with an average score of 93.9 (+0.6%), while Asia continued to show strong improvement at 91.9 (+2.5%).
Independent studies have shown that companies and funds with higher GRESB scores tend to outperform their peers as investments, with both GRESB participation and performance being strong indicators of fund returns.
While 2025 scores rose across markets, year-over-year score increases should not be expected by default. As the Standard continues to evolve and become more robust, future iterations may lead to shifts in outcomes both in terms of scoring average and distribution.
Regional Scores Breakdown By Consecutive Reporting Year
New participants entered the 2025 Real Estate Benchmark at an all-time-high, with first-year scores averaging 68, up 6 points from 2024. This improvement highlights a maturing real estate market, where new entrants are coming to the Benchmark better prepared, with more established management practices, stronger data foundations, and closer alignment with GRESB Standards—demonstrating that sustainability progress is taking place both within and beyond the benchmark.
GRESB Score by Aspect
Understanding the GRESB Rating
The current GRESB Rating methodology is based on your GRESB Score and how it ranks within the quintiles of all participants in the annual GRESB Assessment. The model is recalibrated each year to ensure accurate comparisons. Entities in the top 20% receive a GRESB 5 Star rating, representing the highest achievement, while those in the bottom quintile receive a GRESB 1 Star rating.
Because the GRESB Rating is calculated relative to the global performance of all reporting entities, it offers a clear benchmark of your standing on a global scale. A GRESB 5 Star rating signifies leadership in the industry, achieved by only 20% of participants annually. Entities awarded this rating are encouraged to use the GRESB Rating Logo in their communications to highlight their sustainability performance.
In 2025, the GRESB Foundation began exploring alternative ways to calculate the GRESB Ratings to better align the methodology with capital allocation decisions by investor members. These experiments aim to provide more targeted insights and a meaningful point of engagement between investors and managers. The results of this work will be shared with participants in late 2025.
2025 Sector Leaders and Top Performers
Find the 2025 Sector Leaders for the Real Estate Standing Investments and Development Benchmarks. You can also find the list of Residential Assessment Top Performers.
Keep Exploring
For more insights into this year’s Benchmark data, watch our on-demand GRESB Global Results 2025 program and join us at one of in-person Regional Insights events around the world.