Data Coverage
For the first time in 2025, GRESB collected data coverage levels across key metrics in the GRESB Infrastructure Assessments. The 2025 results show that, on average, the global infrastructure sector is reporting near-universal data coverage—underscoring the industry’s efforts to provide high-quality, actionable data to investors and managers.
These high levels of coverage mark a major step forward for the sector and the GRESB Standards. With comprehensive data coverage in place, the GRESB Foundation can begin to evolve the methodology beyond rewarding disclosure and completeness of data towards a performance-based assessment, signaling whether a company is operating efficiently and effectively. This transition will be a priority for the GRESB Foundation in 2026, with more details to be announced throughout the year.
Net-Zero Progress
In 2025, the share of entities with net-zero policies in place across all Infrastructure Assessments globally increased to 80.4%, up from 76.8% in 2024. Conversely, the percentage of entities with net-zero commitments declined from an average of 59.1% to 53.6%, suggesting a shift from high-level commitments toward implementation and integration, as reflected in the growing prevalence of formal policies.
Net-zero targets showed a slight overall decrease—driven largely by the Americas region, where fund-level targets fell from 44.8% in 2024 to 29.2% in 2025.
Earlier this year, GRESB and the Institutional Investors Group on Climate Change announced the launch of a pioneering approach to assessing the alignment of infrastructure assets with the Net Zero Investment Framework (NZIF) 2.0.
Overall Participation
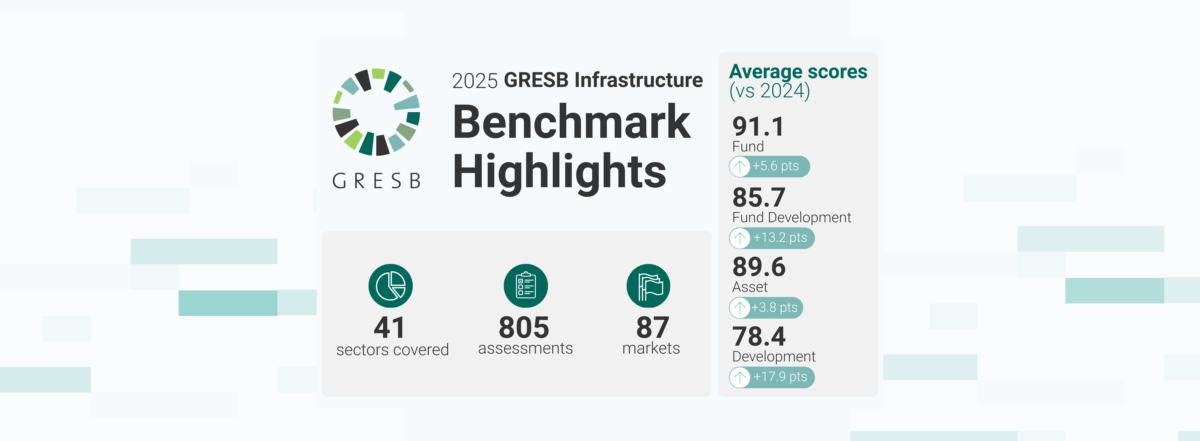
Despite significant market uncertainty, GRESB Members continued to demonstrate strong commitment to responsible investing in 2025—delivering robust insights and measurable progress across the infrastructure landscape. This year, 186 managers, including 19 new entrants, submitted 805 assessments across the Fund, Asset, and Development Asset Assessments.
Participation increased notably in several key sectors. Data Infrastructure doubled at the fund level (+100%), while asset participation grew by 9% in both Data Infrastructure and Environmental Services.
For a detailed overview of GRESB’s approach to digital infrastructure and our new Data Center Benchmark, watch the video “Data Centers: A Fit-for-Purpose Benchmark for the World’s Fastest-Growing Sector,” as part of GRESB’s Global Results 2025 program.
The GRESB Model
GRESB Scores help investors and stakeholders assess the performance and risk of assets within a fund or company. The graph above shows management scores (Y-axis) versus implementation performance (X-axis), with top performers in the upper right quadrant. Over time, this quadrant has become more densely populated, indicating a positive shift in management and performance among infrastructure asset companies and funds, signifying measurable progress in the industry.
The GRESB Regional Model
Scores increased across all Infrastructure Assessments in 2025, reflecting stronger management practices, deeper engagement, and measurable improvements in performance.
- Fund Assessment average score rose to 91.1 (+5.6 vs. 2024)
- Fund Development average score improved to 85.7 (+13.2 vs 2024)
- Asset Assessment average score increased to 89.6 (+3.8 vs. 2024)
- Development Asset Assessment average score improved to 78.4 (+17.9 vs. 2024)
Across regions, Infrastructure Participants continued to show strong performance and steady improvement in 2025.
- For Assets, Europe achieved the highest average score at 90.4 (+3.5%), while the Americas increased to 87.3, recording the largest relative improvement at 9.4% year on year.
- Across Development Assets, Europe led again with an average score of 82.8 (+28.8% year on year), followed by Asia at 80.7, marking the strongest relative gain at 35.7% year on year.
- At the Fund level, Globally Diversified portfolios and Europe achieved the highest scores at 91.4 and 91.3, respectively. Oceania showed the most significant improvement, rising to 90.09 (+11.7% year over year).
Regional Scores Breakdown By Consecutive Reporting Year
New entrants to the 2025 Infrastructure Benchmark arrived better prepared than ever, with significantly higher average starting scores compared to last year. First-year participants achieved an average score of 73.4 for assets (up from 69 in 2024) and 92 for funds (up from 86).
Higher first-year scores highlight a maturing infrastructure market, where new managers and operators are entering the Benchmark with more established management practices, stronger data foundations, and closer alignment with GRESB Standards.
GRESB Score by Aspect
Average GRESB Score by Sector
Understanding the GRESB Rating
The GRESB Rating is determined by the GRESB Score and its position within the quintiles of all participants in the GRESB Assessment, with the model being calibrated annually. Entities in the top quintile receive a GRESB 5 Star rating, while those in the bottom quintile receive a GRESB 1 Star rating, and so on.
Because the GRESB Rating is calculated in comparison to the global performance of reporting entities, it provides a clear indication of your standing on a global scale. GRESB 5 Stars represents the highest rating, acknowledging you as an industry leader. Each year, 20% of entities achieve a GRESB 5 Star rating. You can use the GRESB Rating Logo in your communications.
2025 Infrastructure Sector Leaders
Keep Exploring
For more insights into this year’s Benchmark data, watch our on-demand GRESB Global Results 2025 program and join us at one of in-person Regional Insights events around the world.