Our industry is engaged in an important dialogue to improve the efficiency and resilience of real assets through transparency and industry collaboration. This article is a contribution to this larger conversation and does not necessarily reflect GRESB’s position.
As flooding becomes an increasingly important issue globally, Fathom’s Luke Brown explains what portfolio managers need to know before assessing flood risk to real estate holdings.
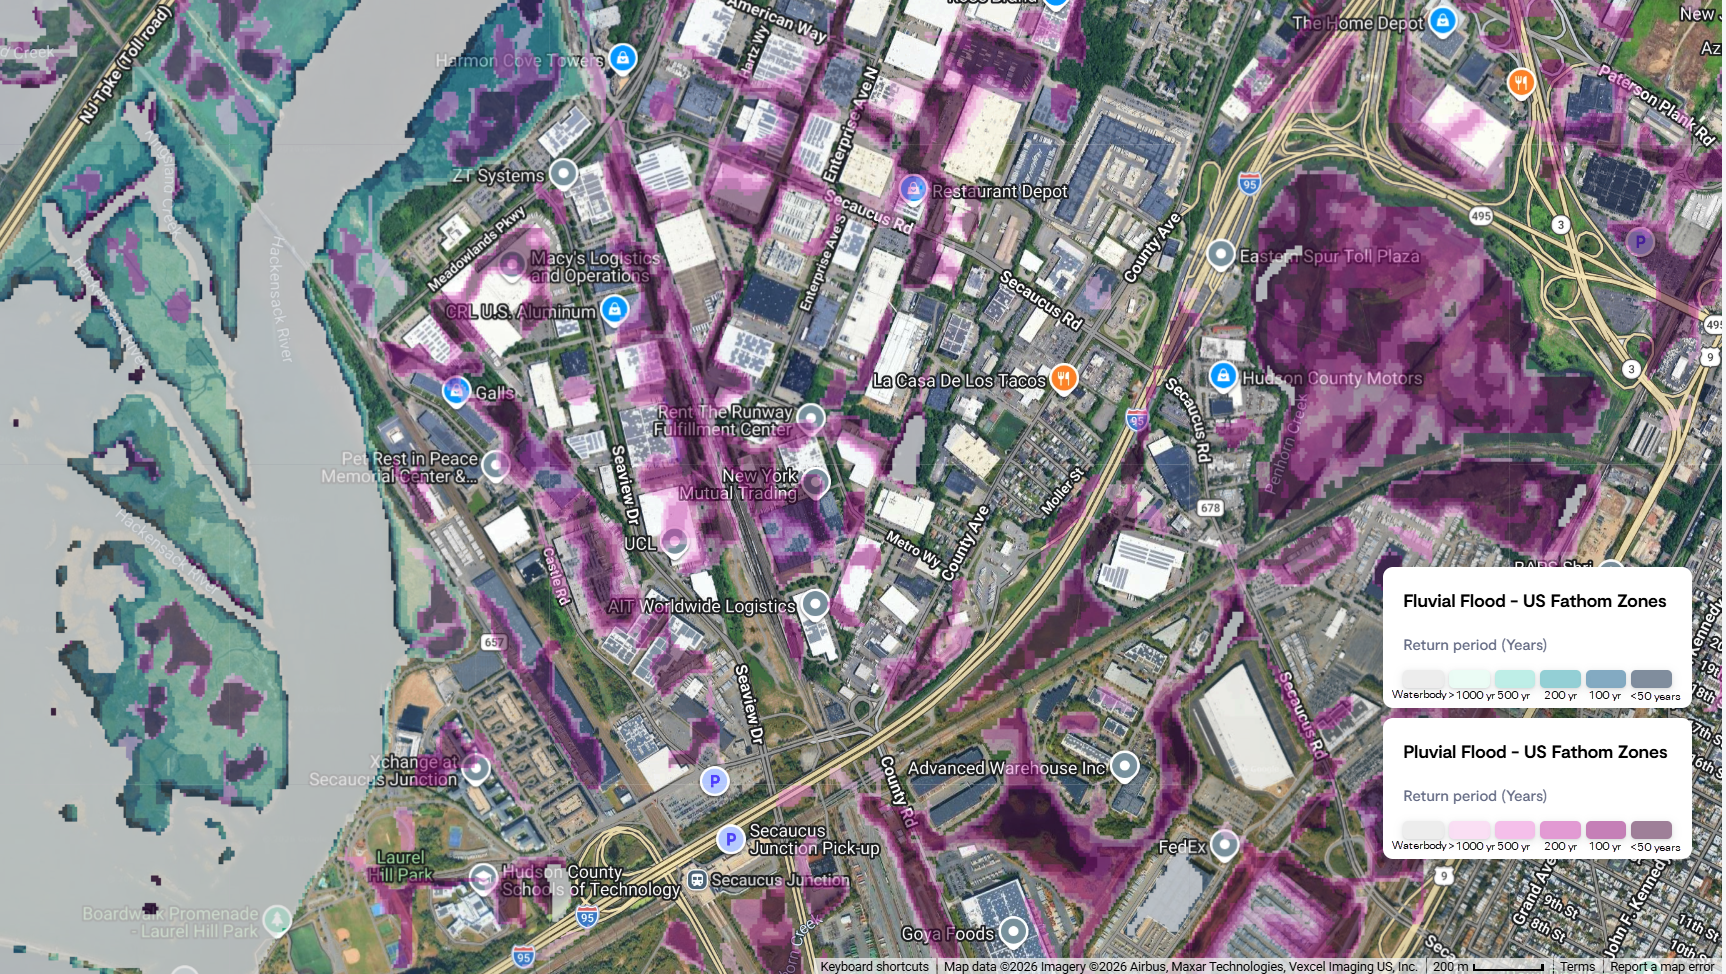
Figure 1. New York, fluvial and pluvial flooding, 1-in-100, defended view.
Whether it’s storms battering the US coastline or severe river flooding in Southeast Asia–it’s becoming hard to ignore the serious human and financial cost of flooding globally. Global natural catastrophe insured losses reached USD 100 billion in 2025; flooding is one of the most prevalent risks, one that banks, insurers, and investors are all paying attention to. The flood data that they rely on for decision-making is critical to better risk management. Seemingly small choices in a flood model can translate into materially different assessments of risk to real estate. With the industry moving past reporting toward genuine physical risk management, it is crucial for GRESB Participants such as real estate specialists and institutional investors to be confident in their models’ output. The critical decisions that these models support include:
- Which assets require further due diligence
- Where to prioritise investment in resilience
- How to manage existing assets
- Portfolio-level risk, capital allocation, and valuation concentration
When you look under the hood of your risk model, the objective is to determine whether it provides credible, consistent, defensible, and validated information about the physical environment–and whether that information is robust enough to fully support the decisions you are making.
The key question: how good is your terrain data?
One of the most critical parts of a catastrophe model or hazard map–especially when assessing flood risk–is the base terrain data, or digital elevation model (DEM). The quality and accuracy of the DEM is critical because without a clear and realistic representation of the Earth’s surface, the model cannot accurately represent flood risk.
The DEM represents the shape and height of the Earth’s surface, which is fundamental in flood modeling because, put simply, water always flows downhill. The topography of the landscape determines:
- Where water can flow
- Which areas are connected
- Where water accumulates
- The depth and extent of flooding
If the terrain is represented inaccurately in a flood model, water can be routed to the wrong place with even small elevation errors substantially altering flow pathways. As a result, an asset could potentially be incorrectly classified as exposed to flood, or missed altogether. At portfolio scale, errors in the underlying terrain data can affect how assets are prioritised for further investigation or resilience planning.
A high quality DEM also represents small-scale features such as flood walls, levees, or slight depressions in a parking lot that act as flood basins. Without these, a risk model cannot provide the “building-level” insights required for GRESB’s Resilience Module.
Bridging the gap: The Fathom and Swiss Re RDS integration
What is critical for investors is a granular flood map that is rooted in science, paired with a data engine which can translate the risks for portfolio-wide stress testing, allowing views of asset exposure and business interruption under various climate scenarios. If you’re looking at a map derived from 90+ metres resolution, and only at corporate headquarters, this is unlikely to be the ‘ground truth’. This issue can be quite glaring when looking at publicly available datasets like
FEMA: below is a comparison of Washington DC’s road network flood risk comparing FEMA to an advanced global flood model from Fathom:
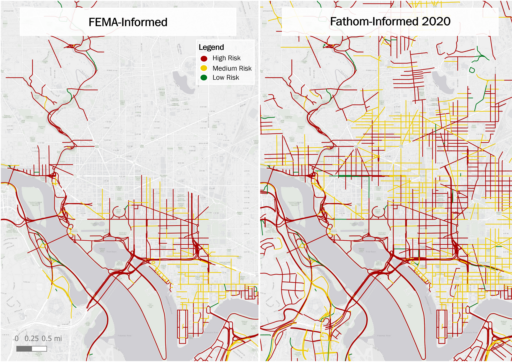
Figure 2: Roads and highway risk of temporary flooding in Washington D.C., based on FEMA-informed and Fathom-informed 2020 analyses. Source: National Capital Region Inland Flood Analysis.
Fathom has successfully produced a validated global flood map at 30 metres resolution, used by banks, governments and corporates. It is also used by the international reinsurer Swiss Re (Fathom’s parent company) to form its own internal view of flood risk, and has been integrated into the company’s Risk Data Services (RDS) platform, which provides investors with a multi-peril view of their climate and physical risk.
Why does this matter for real estate investors and asset owners?
- Insurance-grade physical risk data is now more widely available to financial institutions and real estate managers.
- The issue of inaccurate or incomplete data is increasingly becoming less of a problem as the models improve.
- Users of high quality flood data can now more accurately map the risk to their portfolio, business interruption, and collateral at risk.
Can a flood model offer truly global coverage and consistency?
While accurate terrain data is fundamental, accessing it at global scale is a challenge for the flood modeler. Some of the highest-resolution elevation data is collected using LiDAR (Light Detection and Ranging) from aircraft or drones. This is considered the gold standard of data, but it is expensive and not available in every part of the world.
Satellite-derived data provides broader coverage but can contain systematic errors and does not offer the same level of detail. There is also the challenge of combining datasets collected by different countries and agencies using different standards and methods.
For investors assessing assets across multiple markets, this consistency matters: differences in the quality of the underlying terrain data should not be mistaken for differences in the physical risk of the assets themselves.
Data processing with machine learning
One way to address gaps in coverage and consistency is by combining high-quality LiDAR data from around the world with machine-learning techniques trained on those datasets. Regulators often ask how a financial institution came to its conclusions regarding risk management, hence it’s important not to rely on black box models which don’t explain how they use AI, and don’t have the documentation to back it up.
Fathom uses machine learning to improve global elevation data and create a more accurate and consistent representation of terrain. Models are trained on LiDAR datasets to identify and correct errors and inconsistencies in lower-quality elevation data. These techniques can then be applied where LiDAR is not available, improving the underlying terrain data. Importantly, the resulting outputs can be tested against independent LiDAR datasets that were not used during training.
All of Fathom’s methodologies, including how we use advanced AI and machine learning techniques, are published, validated and fully available for independent review. Having this level of transparency is an important factor to look for when assessing the quality of a flood model.
Why defense data matters
Flood defenses introduce a second layer of complexity: even if you know the terrain, you also need to understand what is protecting people and assets from flooding and whether or how that protection is represented in the model.
Flood defenses can fundamentally change the flood hazard experienced by an asset. But representing them globally is difficult. There is no single comprehensive global database covering every levee, flood wall, embankment, weir or other protection measure.
Even in data-rich regions such as the UK or the US, records for older defenses are imperfect and the model provider may not know which level of flooding they are designed to withstand. While some larger structures such as levees and movable barriers are easier to detect, smaller ones such as walls and weirs are not. And, as with terrain data, the availability and quality of information varies significantly between countries.
This can affect risk in both directions. If a genuine defense isn’t represented, flood exposure could be overstated. If a defense is assumed to provide more protection than it actually does, exposure could be understated. For an asset manager, this could affect how the risk of individual assets and portfolios is assessed and ultimately affect the asset value.
A global model will inevitably encounter places where detailed defense information isn’t available. No global model can have perfect information everywhere. What’s important is how these gaps are identified and accounted for in the modelling.
The layered approach to defense data gaps
Fathom takes a combined approach to dealing with gaps in defense data. It blends:
- Known defense datasets, particularly for places such as the UK, US, and parts of Europe
- The first comprehensive database that maps and quantifies flood defense levels. This replaces generalized or missing assumptions in global flood models with realistic defense standards.
- Information about the standard of protection where that is available, such as FLOPROS
- Assumptions about defense performance where detailed information isn’t available
- Broader datasets and urbanization as a proxy for where flood protection is likely to exist
- Different assumptions about the level of protection depending on the characteristics of the location
What do “defended” and “undefended” mean?
Fathom provides both defended and undefended views of flood risk:
- The undefended view assumes that flood defenses provide no protection, showing a worst-case scenario for what could happen if levees or flood walls failed completely.
- The defended view assumes those structures remain intact and shows the flooding that occurs if water exceeds their capacity and overtops them.
Looking at both views can help users understand how much flood risk depends on the continued performance of existing defenses. For a real estate asset manager, the question isn’t simply, “Is this property defended?” but “How much of the property’s flood-risk profile depends on a defense continuing to perform as assumed?”
Has the model been independently validated?
A provider should clearly demonstrate that not only is the model based on trusted science but also that it produces a more realistic representation of flood hazard.
Terrain can be validated against high-quality, independent observations. The practical impact can then be tested by running flood simulations using different terrain datasets and comparing the resulting outputs. What matters is whether differences in the underlying data can change the comparing assessment of flood exposure.
Checklist: question to ask before trusting a flood model,:
- What terrain data underpins it?
- How is the data processed, and how transparent is the provider?
- How consistent is the data across my portfolio?
- Which flood defenses are represented?
- What assumptions are made where defense information is missing?
- What does “defended” actually mean?
- Can the provider show me the evidence behind these choices?
- How has the model been independently validated?
Ultimately, the value of a flood model lies not in its technical complexity, but in the confidence it gives you in the decisions it supports. Understanding the data, assumptions and validation behind a model helps determine whether its assessment of physical risk is sufficiently robust to inform decisions about individual assets and portfolios – and, importantly, whether you can understand and explain the basis for those decisions.
Sources
- Fathom. n.d.-a. “Fathom Research Papers – Critically Tested & Peer Reviewed.” Accessed October 14, 2026. https://www.fathom.global/research-papers/.
- Fathom. n.d.-b. “Fathom’s Data Informs Transportation Flood Risk.” Case study. Accessed October 14, 2026. https://www.fathom.global/case-study/washington-transportation-planning-board/.
- Scussolini, P., J. C. J. H. Aerts, B. Jongman, et al. 2016. “FLOPROS: An Evolving Global Database of Flood Protection Standards.” Natural Hazards and Earth System Sciences 16 (5): 1049–1061. https://doi.org/10.5194/nhess-16-1049-2016.
- Swiss Re Institute. 2026. Natural Catastrophes in 2025: The Persistent Rise of Wildfire and Storm Risk. Sigma 1/2026. https://www.swissre.com/institute/research/sigma-research/sigma-2026-01-natcat-2025-wildfire-storm-risk.html.
- Wing, O. E. J., P. D. Bates, N. D. Quinn, et al. 2024. “A 30 m Global Flood Inundation Model for Any Climate Scenario.” Water Resources Research 60: e2023WR036460. https://doi.org/10.1029/2023WR036460.
This article was written by Luke Brown, Business Development Manager at Swiss Re. Learn more about Swiss Re here.
Read more from our partners.