Our industry is engaged in an important dialogue to improve the efficiency and resilience of real assets through transparency and industry collaboration. This article is a contribution to this larger conversation and does not necessarily reflect GRESB’s position.
Physical climate risk has become a standard checkpoint in infrastructure investment, and that is progress. But for many investors, the checkpoint produces a traffic light. An asset gets flagged, the deal slows, insurance tightens, capital retreats. Screening was meant to be the first step in managing physical risk; for much of the market it has quietly become the last.
The numbers bear this out. Nearly four in five organizations report climate-related impacts and three-quarters report losses, yet only 38% conduct detailed climate risk assessments, with Asia among the hardest hit (Marsh 2025). The stakes keep growing: more than USD 10 trillion of the climate transition investment committed through 2030 will require insurance coverage (Howden, BCG, and UN Climate Change High-Level Champions 2024). Even capital raised to address climate change, ironically, cannot move without coverage against climate risk. The rest of the built environment should expect no gentler treatment.
Risk management has a well-worn progression for getting unstuck: risks are identified, then analyzed, then evaluated, then treated. GRESB scores risk assessment maturity along the same ladder (GRESB 2025, indicators RM2.1–RM2.3). Most physical climate risk assessment today stops at the first step. What follows carries one site through all four: a coastal industrial estate in Southeast Asia, 23 buildings, exposed to tropical cyclone wind and storm surge.
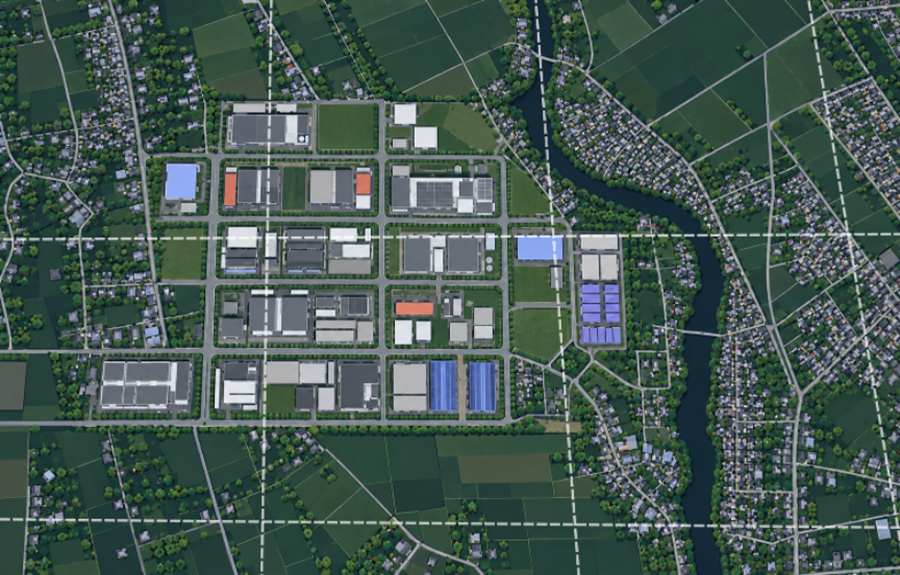
Figure 1. A stylized representation of a coastal industrial estate in Southeast Asia: 23 buildings bordered by a tidal river, with several vacant parcels. Dashed lines show the 1 km grid of a typical screening model.
Identification: where to look closer
Identification is what coarse data can legitimately deliver. A 1 km model establishes that this estate sits in cyclone territory, that surge is plausible along this coast, and that both deserve a closer look. For a manager with 200 assets, that is the right starting point.
What identification does not deliver is usable values. A 1 km pixel reports an average over a square kilometer, but buildings cluster on the safer ground within it; development has always avoided the wettest land, so reading the pixel as any building’s flood risk overstates it for most and understates it for the genuinely exposed few. Coarse screening answers “Is there a hazard here worth investigating?” The moment its numbers flow into pricing, insurance terms, or capital decisions, a flag has been promoted into a verdict it cannot support.
Analysis: the risk quantified
Turning a flag into usable values is what analysis means, and this is where resolution matters. Surge flooding on this estate is not a matter of degree: across a few hundred meters, buildings go from more than a meter of water to none at all, driven by ground elevation differences that are sometimes barely noticeable when walking the site. Wind loads vary too, shaped by terrain and surface roughness. At 1 km, the buildings and the ground beneath them collapse into a single pixel reporting one number: the average of a hill, a riverbank, and everything in between. Modeling at 30 m resolves exactly the gradients that determine which buildings flood and which stay dry.
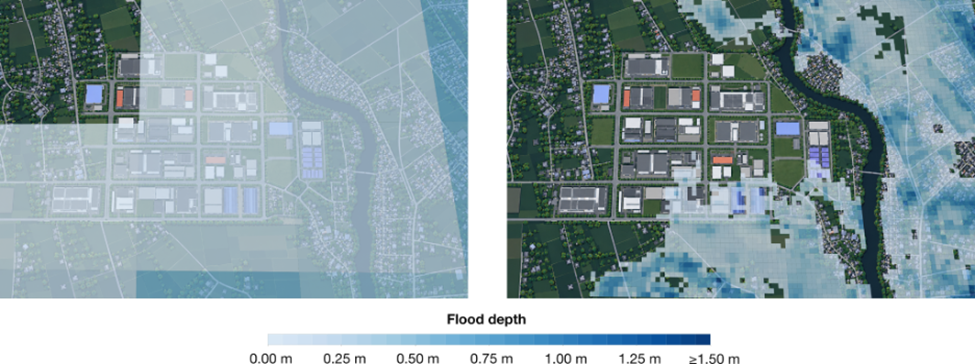
Figure 2. The same 1-in-50-year storm surge event at two resolutions over the identical extent: one depth per cell at 1 km (left); elevation-driven wet and dry at 30 m (right).
Resolved properly, the picture changes in both directions. Most buildings on this estate carry less risk than their coarse grade implied, and a few carry considerably more. Both errors are expensive: false alarms stall sound deals and inflate premiums, while genuinely exposed buildings sit behind a pixel-average clean bill of health, and that unpriced exposure is now cited as a core reason physical climate risk remains systematically underpriced (Marsh 2026). Even compliance turns on resolution: Australia’s climate reporting legislation, in force since January 2025 and reaching mid-size companies from July 2026, asks for the area of properties in 1-in-100-year flood zones, supervisors from Singapore to Hong Kong stress-test lending against flood and typhoon scenarios, and every such figure shifts with the resolution of the map drawing the zone (Treasury Laws Amendment Act 2024; AASB 2024; HKMA 2021).
Evaluation: what the risk costs
Hazard maps do not answer financial questions. Depth and wind speed become useful when combined with each building’s vulnerability, the site’s defenses, and asset values, producing loss metrics: average annual loss for pricing, tail losses for solvency and insurability.
Two buildings on this estate make the point. Building 10, on the higher western side, carries an expected annual loss of 0.30% of its value. Building 1, on low ground near the river, carries 0.92%, three times as much, driven almost entirely by where it stands. Numbers at building level, not postcode level, make risk actionable rather than merely alarming.

Figure 3. Expected annual loss (AAL) for two buildings on the same estate, as a share of building value, from jointly modeled tropical cyclone wind and storm surge.
Evaluation is also where risk meets the market. Rising premiums and reduced insurance availability are now named impact categories in assessment frameworks, and the stakes exceed the premium line: uninsurable assets become unfinanceable, and unfinanceable assets become unsaleable. Disclosure regulation is moving the same direction, from hazard to impact: Europe’s sustainability reporting standards ask companies for the anticipated financial effects of material physical risks, including the monetary value of assets at risk, before considering adaptation, with first reports filed in 2025 (European Commission 2023, ESRS E1, DR E1-9). Such answers rest on building-level loss analysis, not hazard maps. That analysis reveals something useful in its own right: it shows not only which buildings drive the risk but which hazard does. Here, 3 of 23 buildings account for three-quarters of expected loss, and storm surge, not wind, drives roughly 70% of it estate-wide.
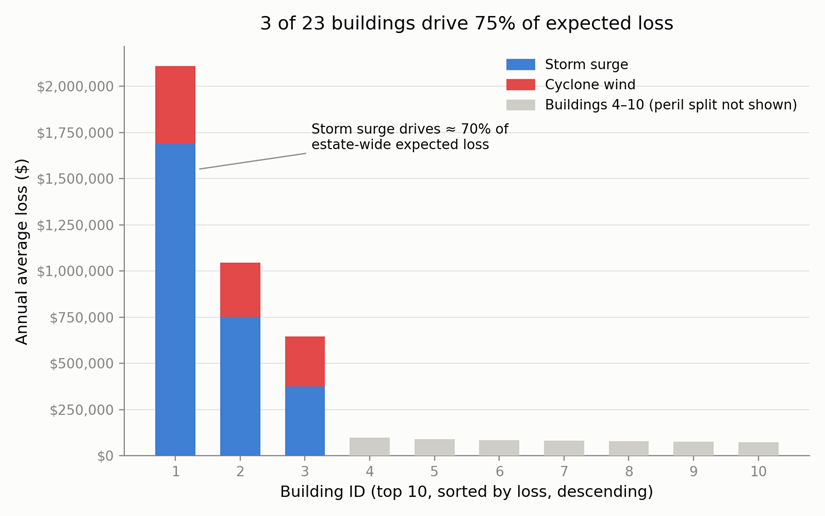
Figure 4. Expected annual loss by building (top 10 of 23 shown, sorted). Three buildings account for three-quarters of the estate’s expected loss; for these, the contribution of storm surge and cyclone wind is shown.
Treatment: what the site does with it
Treatment usually conjures images of retrofits: barriers, reinforcements, pumps. But the cheapest treatment available is a decision made early with good information.
The buildout underway in digital infrastructure shows what happens without one. Severe weather has become the leading cause of loss in one major insurer’s US data center construction portfolio. Meanwhile many facilities are being built on inexpensive land where extreme weather records are thin (CNBC 2026), and nearly four-fifths of global data center capacity sits at elevated risk from acute hazards (First Street 2026). These are siting decisions, made once, with consequences priced at every renewal thereafter. None of this argues against the buildout; it argues for bringing hazard information into the decision while it is still cheap to act on.
On the estate, the same high-resolution hazard that assessed the site becomes the tool for developing it. Siting the next building on Site A rather than Site B cuts its expected loss by more than half, at no additional construction cost, and the advantage holds as the climate warms. Setting design floor elevations from the site’s own surge profile costs little at design stage and far more as a retrofit. And the concentration finding from the previous step makes hardening affordable: a single flood-protection measure on the highest-loss building, aimed at the peril that dominates it, halves its expected loss, under current and future climate alike. One comparison is worth pausing on: a well-sited new building carries roughly the same expected loss as the estate’s worst-exposed building after protection. Good siting, decided early, delivers for free what retrofitting delivers at a price.

Figure 5. Left: two vacant parcels considered for a new building. Right: expected annual loss for existing Buildings 1 and 10 and for the new building at each candidate site, under current and future climate, with and without flood protection on the existing buildings.
Does the financial system reward any of this? Often not, historically: premiums have rarely moved after risk reduction, because the reduction stayed invisible to the models doing the pricing (Jones 2025). That is changing, on evidence and on capital. When Hurricane Sally struck coastal Alabama, homes certified to the FORTIFIED wind standard saw loss frequency 55% to 74% lower than standard construction (University of Alabama CRIR and Alabama Department of Insurance 2025). Commercial insurers are responding in kind: FM Global has returned over USD 600 million to policyholders across two years of resilience credits explicitly meant to fund climate adaptation (FM Global 2022, 2023). Individual transactions point the same way: an Asian REIT’s resilience investments, and its willingness to share the underlying data, recently secured better insurance terms (Marsh and AXA 2026). At the macroeconomic level, adaptation returns a median of roughly four dollars per dollar invested, with benefits typically exceeding costs within three years (GRI and Coalition of Finance Ministers for Climate Action 2026). The pattern across all of these: what gets measured, documented, and made visible to the market gets rewarded. What is missing, at most sites, is information good enough to act on.
One step up a four-step ladder
Identified, analyzed, evaluated, treated. The same underlying analytics at increasing depth, each step unlocking decisions the previous one cannot: credible screening, accurate pricing, informed insurance conversations, and capital deployed to the right parcel at the right elevation. The progression is also a funnel, which is what keeps it affordable: screen all 200 assets, analyze what the screen flags, evaluate what analysis proves material, treat the few that dominate loss. The data that flags a site is the same data that, resolved properly, shows what to build, where, and how high. Most sites today have taken one step. The frameworks reward the climb. Increasingly, so does the market.
This article was written by by Prof. David Lallemant, Director and Chief Scientific Advisor, and Dr. Dennis Wagenaar, Co-Founder, at Ventrx. Learn more about Ventrx here.
Read more from our partners.