Our industry is engaged in an important dialogue to improve the efficiency and resilience of real assets through transparency and industry collaboration. This article is a contribution to this larger conversation and does not necessarily reflect GRESB’s position.
Capital is flowing into data centers at a pace few asset classes have ever seen, with much of that investment sourced from investors who are new to data center development. Institutional capital, REITs, and infrastructure funds are entering a market shaped by AI-driven demand, compressed timelines, and intense competition for power and land. In that environment, it is easy to treat “data center” as a single asset class with a single risk profile.
From a sustainability lens, however, “data center” is not a single, comparable asset class. Scale, computing capacity, resource demand, sustainability performance, risk exposure, and reporting obligations vary by facility type. An edge facility and an AI training campus are about as similar as a retail storefront is to a chemical plant. Investors who evaluate them with the same framework are bound to misprice both.
This distinction between data center types is becoming more consequential as reporting frameworks catch up to the development boom. GRESB has developed a dedicated data center assessment, now in pilot and available for testing through the GRESB Explorer, which will give investors a structured way to benchmark these assets. Understanding the typology-level differences provides those investors with the foundation to engage effectively with that standard and develop stronger investment strategies.
A typology of data centers
The industry generally recognizes six broad facility types: Hyperscale, Colocation, AI/HPC, Edge, and Modular. Each of these data center typologies has a distinct scale, growth trajectory, and binding constraint. These facility types are further described in the table below (Figure A).
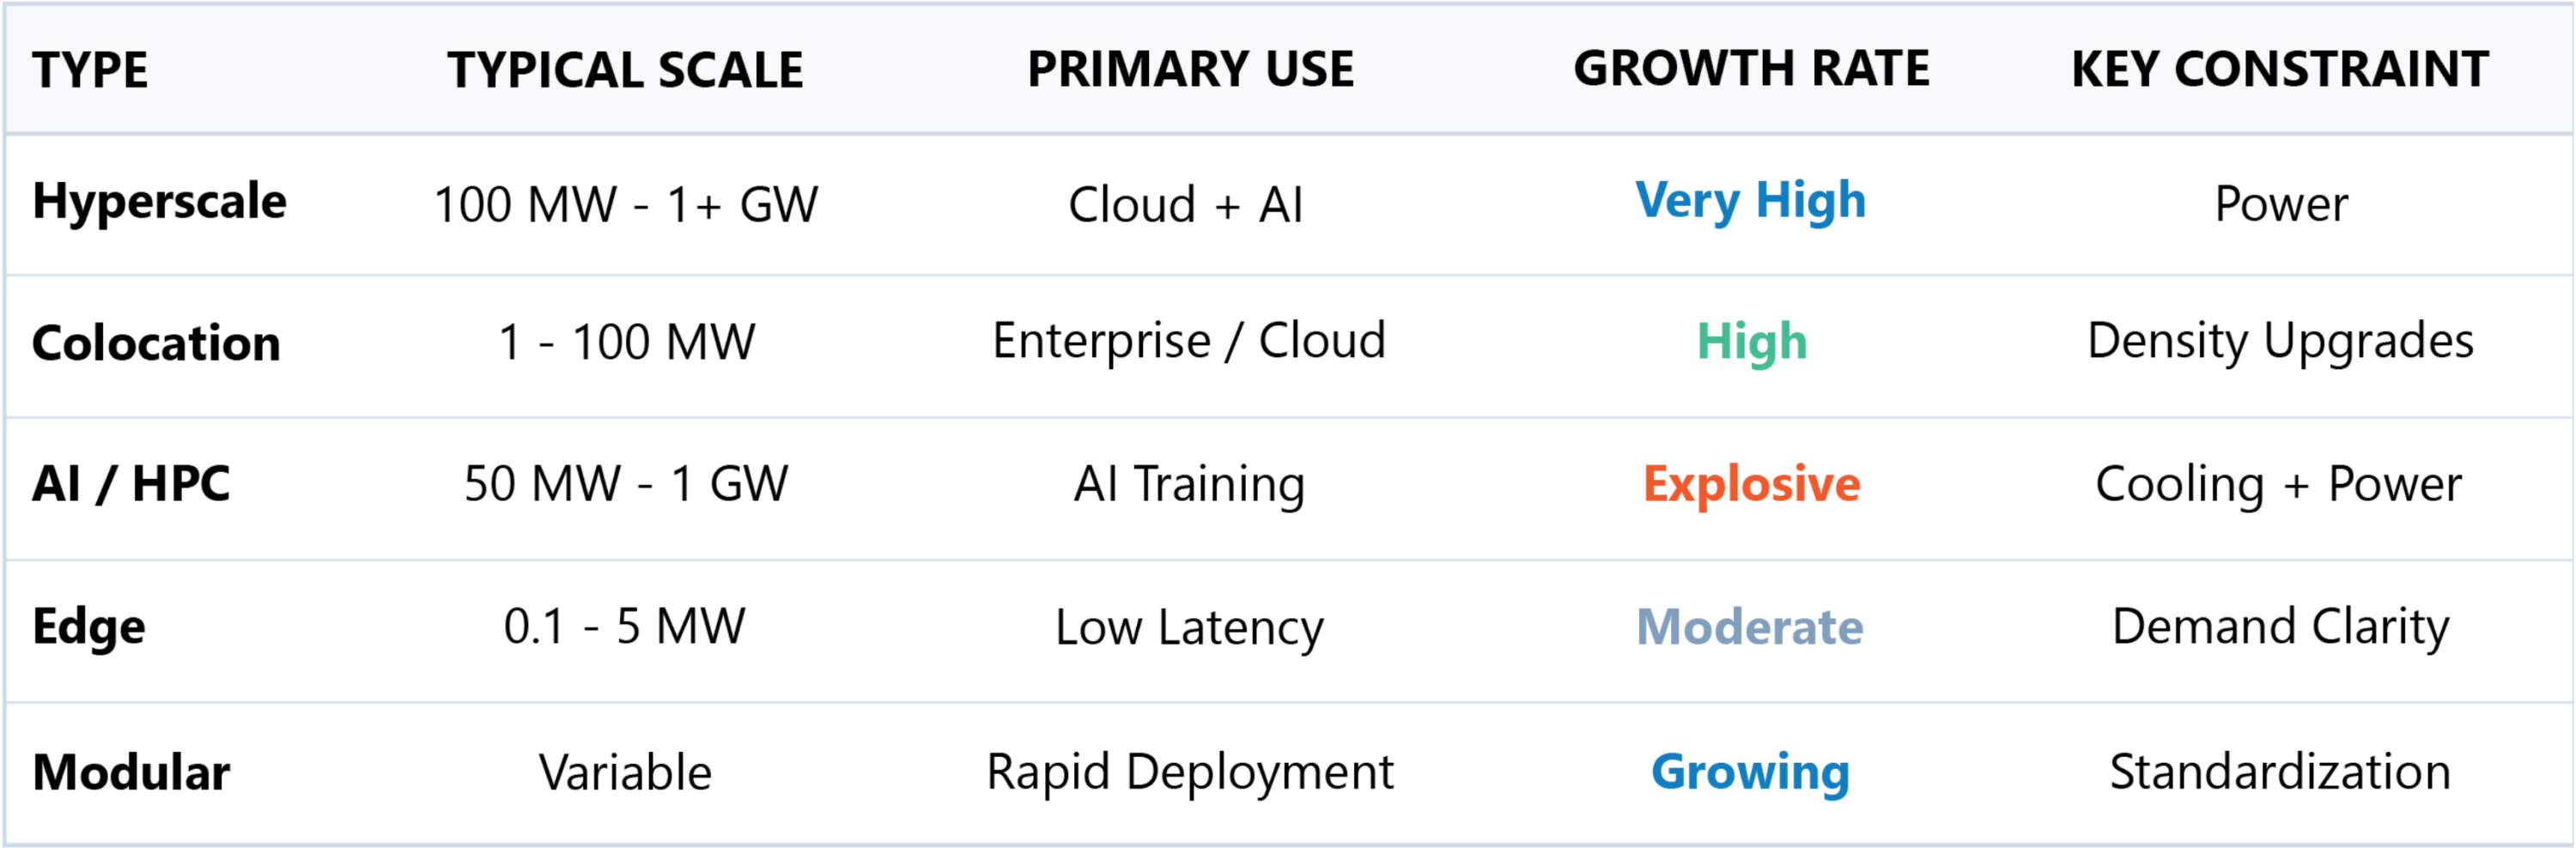
The sustainability signature of each facility type follows from these fundamental characteristics. A hyperscale AI campus concentrates enormous energy and, potentially, water demand in a single community. A distributed edge portfolio spreads modest loads across many grids. Treating all data center types as interchangeable obscures the differences that determine sustainability performance and risk.
Who controls what
Scope 1, 2, and 3 emissions have clean definitional boundaries. However, when it comes to data centers, actual emissions responsibility and risk do not reflect the same clarity. In part, this is because the data center value chain fragments control across investors, developers, operators, and tenants. Traditional landlord and tenant models do not fully account for how data center operational control is structured, and stakeholder models can vary from one asset to the next. For example:
- In some arrangements, the tenant contracts directly with utilities and renewable power providers. In this scenario, the landlord has no control over, or even visibility into, energy use beyond site and house loads, which are small by comparison.
- In other situations, the operator manages the cooling plant and energy procurement while the tenant drives the compute load that determines demand. The same megawatt of consumption may sit in different scopes for different parties depending on how the deal is structured. This, in turn, means reported metrics from two similar facilities may not be comparable.
For investors, the essential question is: what is within your control? The answer depends on what the operating agreements say and which facility type you hold. Understanding that mapping is the foundation for credible reporting and for knowing which sustainability commitments you can realistically stand behind.
Developing metrics that matter
The industry’s standard vocabulary for data center sustainability starts with two ratios:
- Power usage effectiveness (PUE) is total facility power consumption divided by IT power consumption; a value near 1.0 means nearly all power reaches the IT equipment, while values approaching 2.0 indicate significant overhead.
- Water usage effectiveness (WUE) is total facility water consumption divided by IT power consumption, ranging from zero for water-free designs to more than 3 liters per kilowatt-hour for water-intensive ones, with roughly 1.8 as a typical average.
These metrics are useful, but as standalone numbers, they can obscure tradeoffs. The clearest example of such a tradeoff is the energy-water nexus in cooling design. Across the spectrum of heat-rejection technologies, from dry coolers to open cooling towers, water use and energy use move in opposite directions. Dry systems use little or no water but demand more power and physical footprint. Evaporative systems save energy by consuming water, in some facility types up to roughly 2 billion gallons per year, comparable to a town of 50,000 people.
WUE+ is an emerging metric that incorporates the water embodied in power generation, regional water scarcity, and reuse efficiency, moving the conversation from how much water a facility uses toward how much water stress it creates. This reframe creates a clearer sustainability picture than the individual consideration of PUE and WUE. However, there are still few performance metrics to describe how well servers and IT stack operate to deliver services. Anecdotal evidence suggests significant inefficiency from software to server to the broader digital ecosystem. The most efficient building in the world can still host wasteful computing, and our current standard metrics mask that phenomenon.
Measurement of community-level impacts poses even greater challenges. Concerns about water and energy supply, infrastructure capacity, and utility rate impacts do not yet have well-established models or metrics associated. Policies and development agreements are beginning to shift more of these costs onto developers, but legacy tax incentive structures and the absence of policies designed for projects of this scale mean there is significant ground to make up. Water access illustrates this complexity well: water rights in many regions date back centuries, and operators often secure historic rights from agricultural or industrial users in addition to drawing on municipal supply. A conventional utility bill does not fully capture this resource picture.
Implications of data center typologies for investment strategy
So, what do investors need to prioritize to sustainably manage their data center portfolio?
- The primary implication of the diversity within data center typologies is that there is no universally correct answer to this question. Sustainable data center development is regional and contextual. A facility optimized for one geography may be counterintuitive to sustainability goals in another, and different typologies pose drastically different sustainability impacts.
- The second implication concerns reporting. Investors should understand what they can influence across Scope 1, 2, and 3 for the data centers in their portfolios, and that influence flows directly from the control structures described above. Investor influence will differ by facility type and by deal structure, but understanding it is a critical prerequisite for disclosure that holds up to scrutiny.
- The third implication is newer: community pressure and license to operate are emerging as material investment risks. As pressure on energy and water infrastructure is felt more acutely, communities and regulators are responding, and the consequences range from higher operating costs to the loss of license to operate. Some developers are engaging communities well, understanding local resource limitations and investing in community infrastructure to reduce this risk. Others are not. The challenge for investors is that there is not yet sufficient transparency, or an established framework, to tell the difference from the outside. Until such frameworks mature, the quality of a developer’s community engagement belongs on the diligence agenda alongside the technical fundamentals.
Data center investors who understand typology-level distinctions will price their risks more accurately, ask sharper questions in diligence, and position their portfolios ahead of the GRESB data center standard rather than reacting to it. In a market moving this quickly, making sense of that nuance is a practical step forward for shrewd investment.
References
- Osaka, Shannon. “A New Front in the Water Wars: Thirsty, Giant Data Centers.” The Washington Post, April 25, 2023. https://www.washingtonpost.com/climate-environment/2023/04/25/data-centers-drought-water-use/
- Tozzi, Christopher. “A Guide to Data Center Water Usage Effectiveness (WUE) and Best Practices.” Data Center Knowledge, January 17, 2025. https://www.datacenterknowledge.com/cooling/a-guide-to-data-center-water-usage-effectiveness-wue-and-best-practices
This article was written by Angela Wisely, Director, and Josh Hatch, Partner, at Brightworks Sustainability. Learn more about Brightworks Sustainability here.
Read more from our partners.