
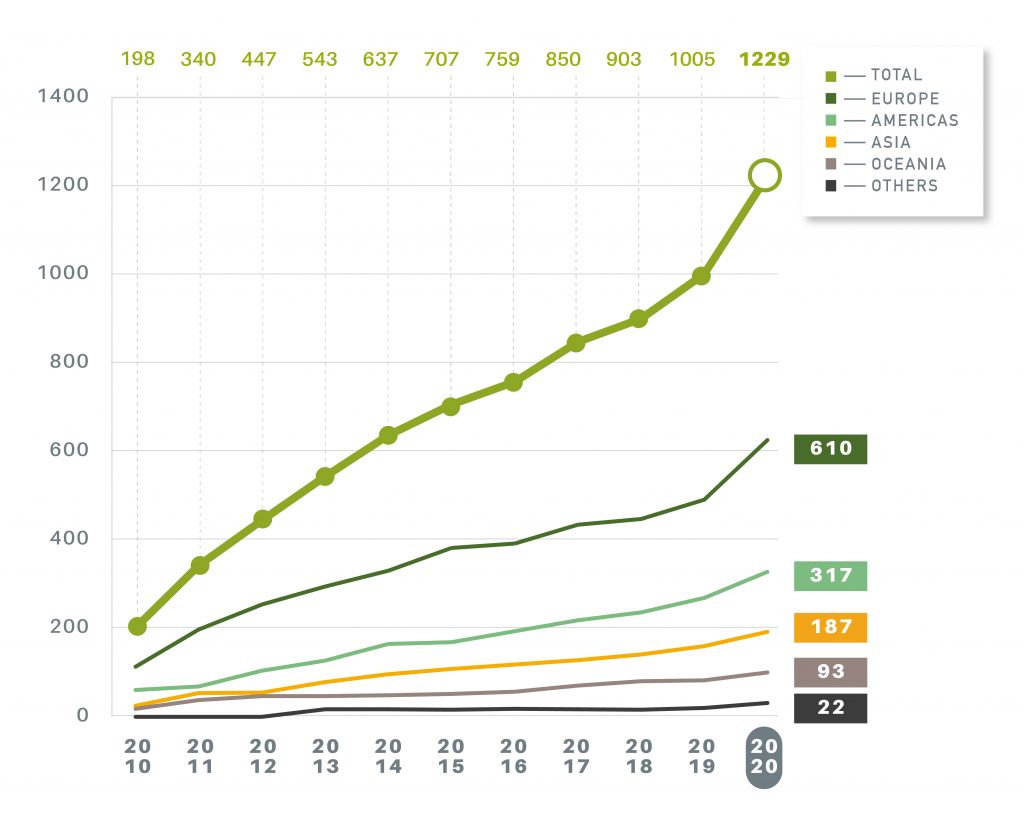
Coverage and growth
Participation leaps 22% amid accelerating investor demand for ESG data
Participation in the 2020 Assessment grew by 22% to cover 1,229 portfolios (2019: 1,005) worth more than USD $4.8 trillion AUM.
This increase in participation, coming despite the challenges of the covid-19 crisis, shows an industry responding decisively to the accelerating investor demand for comparable ESG data.
The private sector led the growth trend, with participation growing 32% to cover 953 non-listed portfolios (2019: 723). On the listed side, 271 REITs and property companies reported to GRESB (2019: 240), an increase of 13% on the previous year.
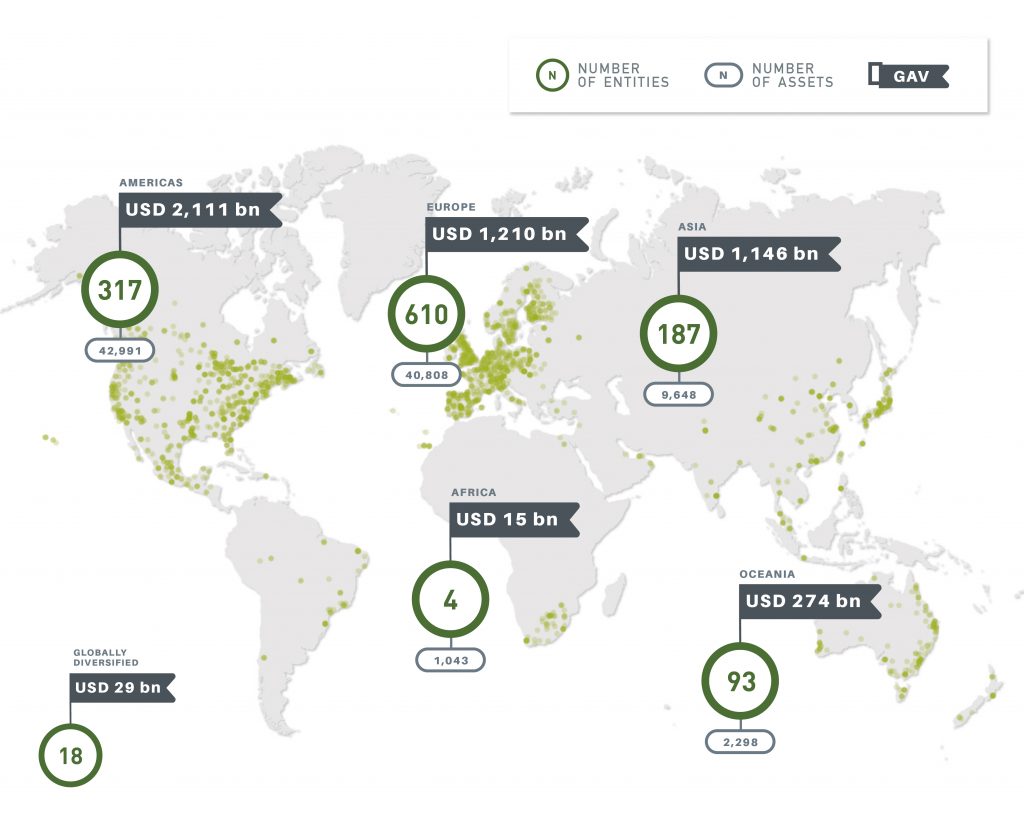
Benchmark size and asset location
96,000 assets, across 64 countries represented in the benchmark
The global map shows the breadth of the GRESB Real Estate Assessment. Each of the green dots represent individual assets equating to over 96,000 assets, across 64 countries, representing USD $4.8 trillion in AUM.
Over $2 trillion is represented by the Americas, and $1.2 trillion in Europe. The largest increase in value (24%) came from the Asian markets – now with $1.1 trillion AUM.
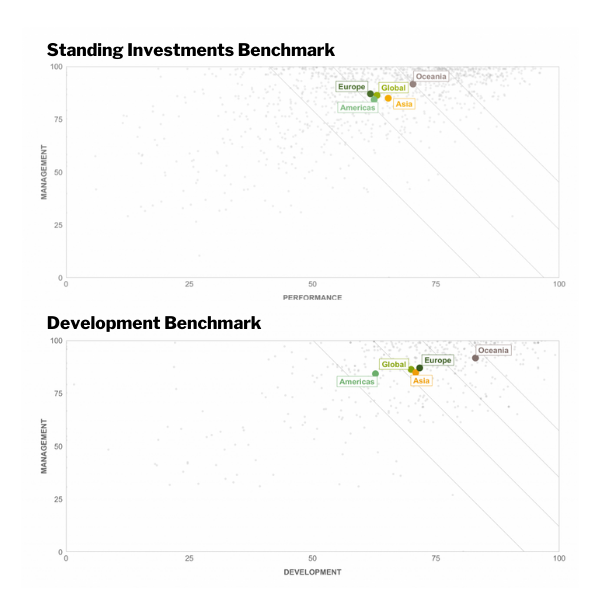
GRESB Scores
2020 marked an inflection point for the GRESB Real Estate Assessment
We introduced mandatory asset-level data reporting to improve data quality and implemented a new reporting structure that placed a higher weighting (70%) on the Performance Component towards the overall GRESB Score. This benchmark-wide score reset resulted in the average GRESB Score falling to 70 (2019: 72).
The regional breakdown shows Oceania still ahead, with an average GRESB Score of 77. The Asian real estate sector comes in second, with 72, followed by Europe at 69.5, just slightly ahead of the Americas at 69.
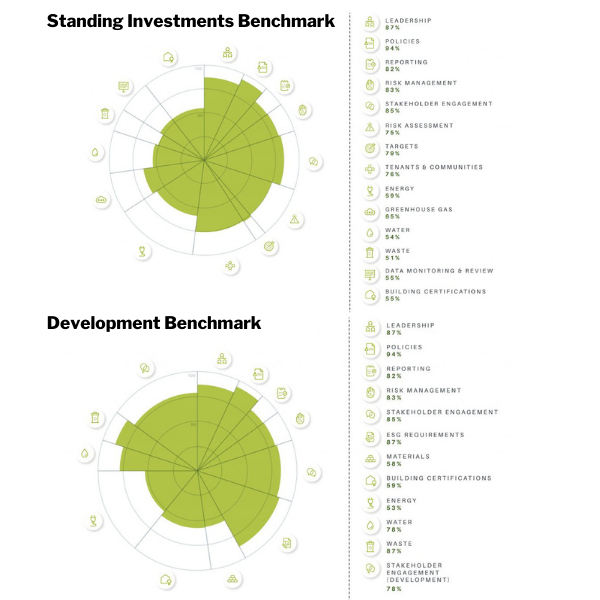
Aspect Scores
A restructured Assessment providing more insight at the Aspect level
The 2020 Real Estate Assessment is structured into 2 Components and 14 Aspects, each addressing a specific type of ESG issue. The Management Component covers the 5 first Aspects and the Performance Component covers the last 9.
Improvements on last year are primarily due to increased granularity in the key performance indicators (now broken down into Energy, GHG, Water and Waste) and stakeholder engagement (which now identifies Tenant & Communities as a separate Aspect).
Scores
-
# stars Top Limit Bottom Limit Difference Average
Standing
Investments
ScoreAverage
Management
ScoreAverage
Performance
Score5 97.12 83.52 13.59 88.04 28.86 59.18 4 83.51 76.82 6.69 80.41 28.17 52.24 3 76.81 67.84 8.98 72.24 26.93 45.31 2 67.78 58.80 8.98 63.61 25.93 37.67 1 58.60 16.79 41.80 46.63 20.49 26.14 -
# stars Top Limit Bottom Limit Difference Average
Overall
Development
ScoreAverage
Management
ScoreAverage
Development
Score5 98.00 87.17 10.83 91.52 28.94 62.58 4 87.15 80.57 6.58 83.41 27.10 56.31 3 80.57 73.60 6.97 77.04 26.85 50.18 2 73.46 65.22 8.24 69.56 24.51 45.05 1 65.04 13.46 51.58 49.29 18.73 30.56 -
The table provides a comparison between 2019 and 2020 scores by region.
Region Year Management Performance Development Overall Africa 2019 58 46.2 43.2 49.2 2020 62.33 53.42 38.14 56.1 Americas 2019 78.6 69.7 57.2 72.1 2020 84.32 62.47 43.91 68.98 Asia 2019 76.9 71.2 64.4 72.7 2020 85 65.33 49.63 71.7 Diversified 2019 82.5 68.8 N/A 72.3 2020 90.48 61.29 45.44 70.05 Europe 2019 80.2 67.3 65 70.7 2020 87.07 61.71 50.19 69.53 Oceania 2019 84.8 79.5 77.7 80.9 2020 91.68 70.35 58.11 76.96
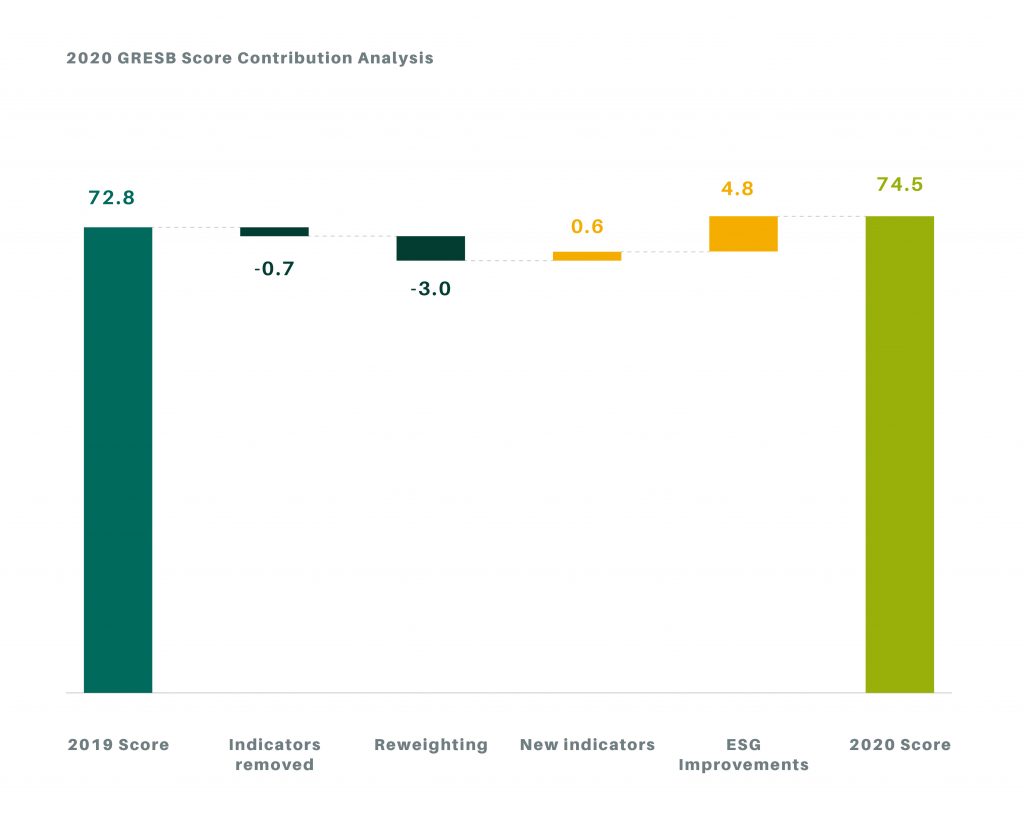
Average GRESB Scores independent of Assessment restructuring
When controlling for changes made to the 2020 Assessment, average GRESB Scores increase
The waterfall chart provides the quantified contribution of all material changes to the Assessment this year. The analysis provides an estimate of changes to ESG performance by markets globally, independent of the Assessment’s restructuring.
The results show 2020 average GRESB Scores increasing by 1.7 points, outperforming the drop in scores resulting from the recalibration of the framework.
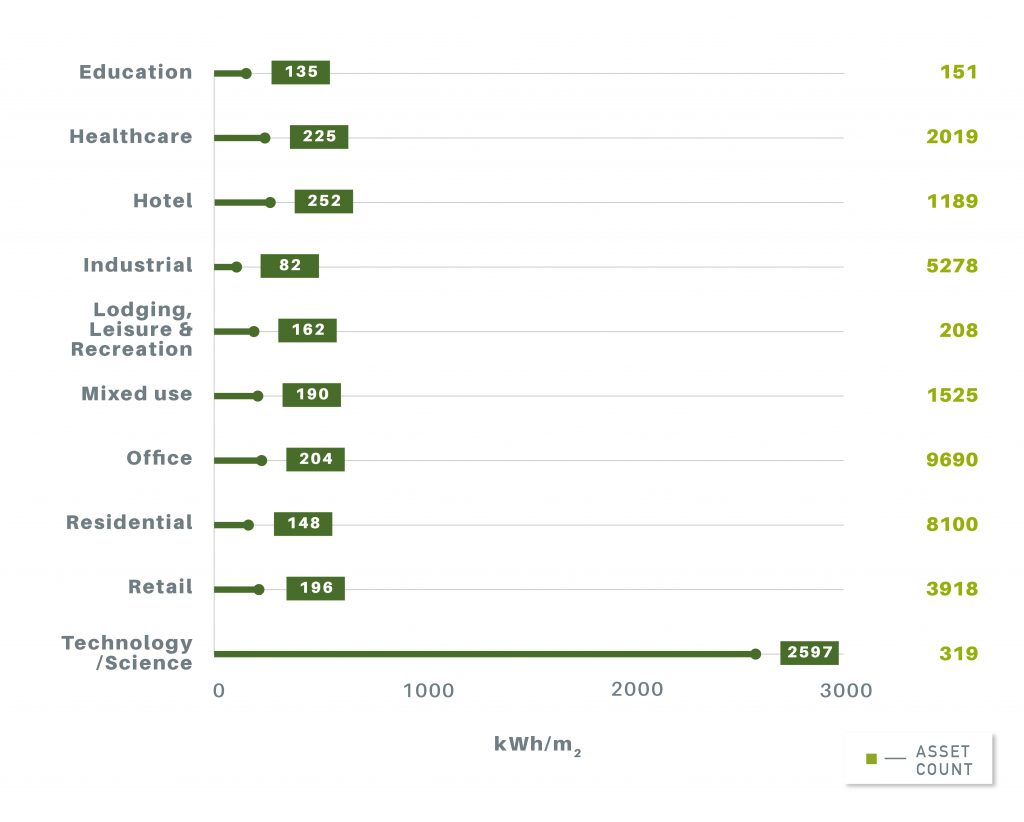
More accurate energy intensities globally based on a larger number of assets
In 2020 the asset-level reporting became mandatory in the Real Estate Assessment. This requirement came with enhanced quality controls at the asset-level leading to higher data quality in the benchmark.
The total number of assets reported was 96,000 out of which 36,000 presented sufficient data coverage to be included in calculation of energy intensities (note: property type “Other” is not included in the chart).
More granular and higher quality data are necessary to provide capital markets with better consolidated ESG performance metrics.
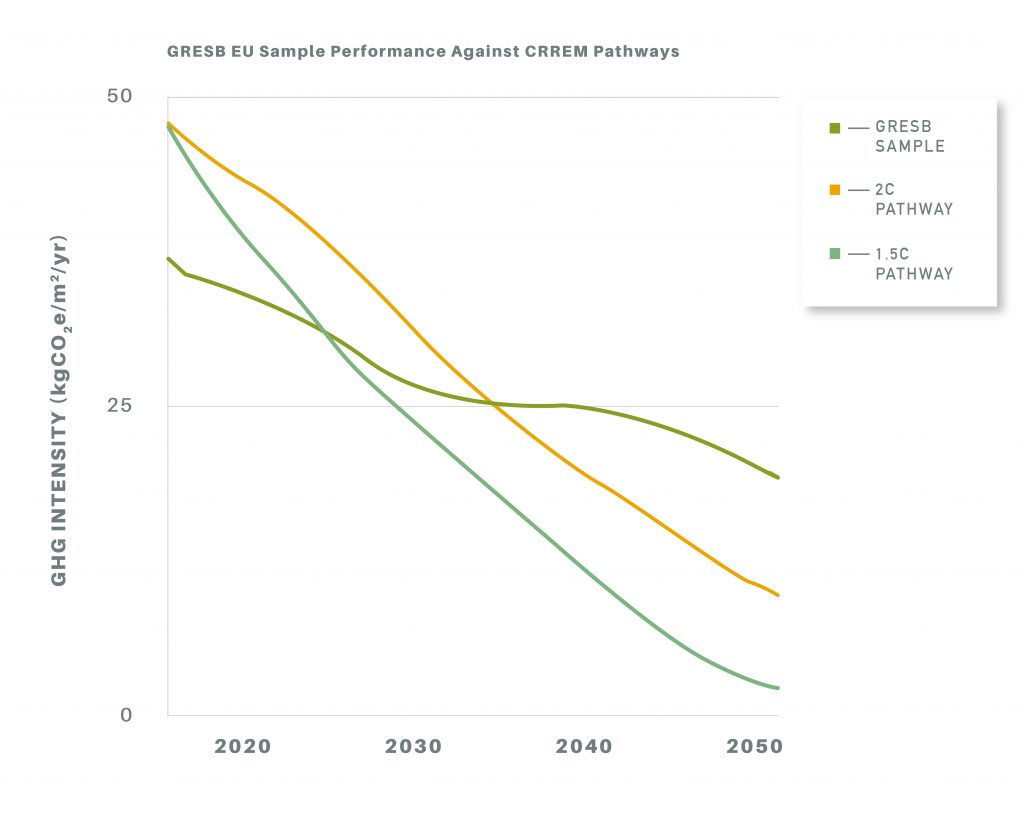
CRREM analysis provides a bottom-up understanding of portfolio alignment with Paris goals
GRESB is a member of the Carbon Risk Real Estate Monitor (CRREM) consortium. CRREM portfolio performance projections are built up from asset-level data and align closely with the performance data reported in the 2020 Assessment.
Early analysis of participants who were able to provide 100% data coverage in Europe shows that the average GHG intensity of participants exceeds the CRREM 2C decarbonization pathway by 2035, and the 1.5C pathway as early as 2027.
Analysis of coverage by certification scheme
-
Sector Africa Americas Asia Europe Oceania Global Education Total 46.1% Total 12.9% Total 13.6% LEED – Building Operations and Maintenance (O+M) 96.1% BREEAM – In Use 71.7% BREEAM – In Use 65.7% BOMA – BEST 3.9% Miljöbyggnad – Existing Buildings 28.3% Miljöbyggnad – Existing Buildings 25.9% LEED – Building Operations and Maintenance (O+M) 8.1% BOMA – BEST 0.3% Healthcare Total 0.1% Total 6.5% Total 84.6% Total 2% Fitwel – Fitwel – Built 67.8% BREEAM – In Use 46.9% NABERS – Multi-rating 72.9% BREEAM – In Use 43.3% Green Globes – Existing Buildings 24.7% GPR Gebouw – GPR Gebouw – Operational 39.8% Green Star – Performance 27.1% GPR Gebouw – GPR Gebouw – Operational 36.7% BOMA – BEST 7.5% Miljöbyggnad – Existing Buildings 13.3% Miljöbyggnad – Existing Buildings 12.2% NABERS – Multi-rating 3% Fitwel – Fitwel – Built 2.5% Hotel Total 61.1% Total 5.2% Total 32.5% Total 7.3% Total 33.6% TripAdvisor – GreenLeaders 63.2% LEED – Building Operations and Maintenance (O+M) 32.6% BREEAM – In Use 34.1% Green Star – Performance 100% TripAdvisor – GreenLeaders 48.3% Green Key – Eco-Rating Program 16.9% BCA Green Mark – Existing Buildings 21.6% TripAdvisor – GreenLeaders 23.9% Green Key – Eco-Rating Program 13.7% Green Key International – Ecolabel 10.6% CASBEE – Existing Buildings 18.6% Svanen – Miljömärkta – Operational 20.9% BREEAM – In Use 10.4% Green Seal – Hotels and Lodging 6.2% IGBC Green – Existing Buildings 17.4% Green Key – Eco-Rating Program 8.8% Green Key International – Ecolabel 7.6% Arc – Performance Certificates – 3 1.6% CASBEE – for Real Estate 9.9% Green Seal – Hotels and Lodging 3.7% Svanen – Miljömärkta – Operational 6.4% Industrial Total 7.4% Total 25.1% Total 5.4% Total 22.4% Total 9.3% BOMA – BEST 89.5% DBJ Green Building Certification – DBJ Green Building Certification 38.9% BREEAM – In Use 78.1% Green Star – Performance 99.7% BOMA – BEST 35% LEED – Building Operations and Maintenance (O+M) 4.6% CASBEE – for Real Estate 34.8% SGBC Green Building EU – SGBC GreenBuilding EU – Operational 6.3% NABERS – Multi-rating 0.3% BREEAM – In Use 16.6% BREEAM – In Use 3.2% BCA Green Mark – Existing Buildings 10.9% Green Star – Performance 3.3% DBJ Green Building Certification – DBJ Green Building Certification 12.3% Arc – Performance Certificates – 3 2.7% CASBEE – Existing Buildings 5.6% DGNB – Existing Buildings 3.2% CASBEE – for Real Estate 11% LEED – Building Operations and Maintenance (O+M) 5% Green Star – Performance 10.3% Lodging, Leisure & Recreation Total 38.4% Total 1.4% Total 63.7% Total 1.7% LEED – Building Operations and Maintenance (O+M) 57.7% BREEAM – In Use 61.8% NABERS – Multi-rating 100% LEED – Building Operations and Maintenance (O+M) 40.4% BOMA – BEST 42.3% LEED – Building Operations and Maintenance (O+M) 38.2% BREEAM – In Use 39% BOMA – BEST 11.9% NABERS – Multi-rating 8.7% Mixed use Total 37.8% Total 27.8% Total 43.4% Total 19.9% Total 14% Total 30.6% Green Star SA – Performance 100% LEED – Building Operations and Maintenance (O+M) 54% BEAM Plus – Existing Building 26.9% BREEAM – In Use 32.4% Green Star – Performance 100% LEED – Building Operations and Maintenance (O+M) 25.3% BOMA – BEST 37.5% BCA Green Mark – Existing Buildings 18.2% LEED – Building Operations and Maintenance (O+M) 26.8% BEAM Plus – Existing Building 14.7% IREM Certified Sustainable Properties – IREM Certified Sustainable Properties 4.1% LEED – Building Operations and Maintenance (O+M) 16.2% Miljöbyggnad – Existing Buildings 4.3% BCA Green Mark – Existing Buildings 10% BOMA – 360 3.2% DBJ Green Building Certification – DBJ Green Building Certification 15.3% DGNB – Existing Buildings 2.7% BREEAM – In Use 8.7% Fitwel – Fitwel – Built 1.2% RESET Air – Core and Shell 14.1% DBJ Green Building Certification – DBJ Green Building Certification 8.4% Office Total 38.5% Total 27.8% Total 53.6% Total 29.5% Total 70.8% Total 49.3% Green Star SA – Performance 95.6% LEED – Building Operations and Maintenance (O+M) 59.4% DBJ Green Building Certification – DBJ Green Building Certification 44.1% BREEAM – In Use 59.8% Green Star – Performance 63.5% LEED – Building Operations and Maintenance (O+M) 45.1% Green Star – Performance 4.4% BOMA – BEST 19.4% LEED – Building Operations and Maintenance (O+M) 28.2% LEED – Building Operations and Maintenance (O+M) 16.3% NABERS – Multi-rating 34.8% BOMA – BEST 13.1% BOMA – 360 13.1% CASBEE – for Real Estate 10.3% NF HQE – Bâtiments Tertiaires en Exploitation 11.7% Green Star NZ – Performance 0.6% BOMA – 360 8.9% Fitwel – Fitwel – Built 6.6% BCA Green Mark – Existing Buildings 8.9% Miljöbyggnad – Existing Buildings 2.7% Cleaning Accountability Framework – CAF Building Certification 0.6% BREEAM – In Use 6.9% IREM Certified Sustainable Properties – IREM Certified Sustainable Properties 0.8% Hong Kong Environmental Protection Department – IAQ Certification 1.7% Fitwel – Fitwel – Built 0.5% Green Star – Performance 5.7% Other Total 0.1% Total 2.6% Total 16% Total 1.8% LEED – Building Operations and Maintenance (O+M) 53.7% BCA Green Mark – Existing Buildings 100% BREEAM – In Use 43.8% BREEAM – In Use 40.3% BOMA – 360 43.6% In-house scheme – pom+duro Sustainability Rating Scheme 28.3% DGNB – Existing Buildings 22.9% BOMA – BEST 2.7% DGNB – Existing Buildings 24.9% BCA Green Mark – Existing Buildings 3.7% Miljöbyggnad – Existing Buildings 3% Miljöbyggnad – Existing Buildings 2.8% LEED – Building Operations and Maintenance (O+M) 0% Residential Total 10.8% Total 11.3% Total 17.4% Total 50.5% Total 13.1% IREM Certified Sustainable Properties – IREM Certified Sustainable Properties 42.6% DBJ Green Building Certification – DBJ Green Building Certification 100% GPR Gebouw – GPR Gebouw – Operational 41.3% Green Star – Performance 100% IREM Certified Sustainable Properties – IREM Certified Sustainable Properties 23.1% In-house scheme – Equity Residential Green Property 18.3% NF Habitat – HQE Exploitation 24.4% GPR Gebouw – GPR Gebouw – Operational 14.4% BOMA – BEST 17.7% DGBC Woonmerk – Woon Kwaliteit Richtlijn 1.6% BOMA – BEST 9.6% Certified Rental Building Program – Certified Rental Building 13.6% Miljöbyggnad – Existing Buildings 1.5% Fitwel – Fitwel – Built 3.2% Retail Total 21% Total 36.8% Total 32.3% Total 45.5% Total 28.2% BOMA – BEST 59.5% DBJ Green Building Certification – DBJ Green Building Certification 42.8% BREEAM – In Use 90.9% Green Star – Performance 98.1% BREEAM – In Use 31.3% IREM Certified Sustainable Properties – IREM Certified Sustainable Properties 25.8% CASBEE – for Real Estate 20.4% DGNB – Existing Buildings 3.7% Green Star SA – Performance 0.8% BOMA – BEST 20.5% BREEAM – In Use 8.8% BCA Green Mark – Existing Buildings 16.5% LEED – Building Operations and Maintenance (O+M) 1.4% NABERS – Multi-rating 0.6% Green Star – Performance 12.6% LEED – Building Operations and Maintenance (O+M) 2.9% LEED – Building Operations and Maintenance (O+M) 6.6% GPR Gebouw – GPR Gebouw – Operational 1.1% Green Star NZ – Performance 0.5% DBJ Green Building Certification – DBJ Green Building Certification 9.5% Arc – Performance Certificates – 3 1.2% BEAM Plus – Existing Building – Selective Scheme 5.9% IREM Certified Sustainable Properties – IREM Certified Sustainable Properties 8.9% Technology/Science Total 3.9% Total 36.8% Total 2.2% Total 21.1% Total 4.1% Fitwel – Fitwel – Built 50.7% BCA Green Mark – Existing Buildings 100% Miljöbyggnad – Existing Buildings 100% NABERS – Multi-rating 100% Fitwel – Fitwel – Built 42.1% Green Globes – Existing Buildings 22.7% Green Globes – Existing Buildings 18.9% LEED – Building Operations and Maintenance (O+M) 12.2% LEED – Building Operations and Maintenance (O+M) 10.1% WELL Building Standard – Existing Interiors 10.6% WELL Building Standard – Existing Interiors 8.8% CEEDA – Design-Operate 2.2% BCA Green Mark – Existing Buildings 8% Overall Total 9.3% Total 20.2% Total 33.1% Total 17.6% Total 45.6% Total 22.1% Green Star SA – Performance 96% LEED – Building Operations and Maintenance (O+M) 39% DBJ Green Building Certification – DBJ Green Building Certification 40.6% BREEAM – In Use 61.2% Green Star – Performance 81.4% LEED – Building Operations and Maintenance (O+M) 24.4% Green Star – Performance 4% BOMA – BEST 31.1% CASBEE – for Real Estate 17.5% GPR Gebouw – GPR Gebouw – Operational 6.9% NABERS – Multi-rating 17.3% BOMA – BEST 16.4% BOMA – 360 8.4% LEED – Building Operations and Maintenance (O+M) 14.5% LEED – Building Operations and Maintenance (O+M) 6.4% Green Star NZ – Performance 0.5% BREEAM – In Use 13.5% IREM Certified Sustainable Properties – IREM Certified Sustainable Properties 8.3% BCA Green Mark – Existing Buildings 12.6% NF HQE – Bâtiments Tertiaires en Exploitation 3.7% Green Star SA – Performance 0.3% Green Star – Performance 7.4% Fitwel – Fitwel – Built 4.6% BEAM Plus – Existing Building 3.6% Cleaning Accountability Framework – CAF Building Certification 0.3% DBJ Green Building Certification – DBJ Green Building Certification 7% -
Sector Africa Americas Asia Europe Oceania Global Education Total 15.1% Total 14.2% Total 14.1% LEED – Interior Design and Construction (ID+C) 66.7% BREEAM – New Construction 61.4% BREEAM – New Construction 56.8% LEED – Building Design and Construction (BD+C) 33.3% LEED – Building Design and Construction (BD+C) 31.8% LEED – Building Design and Construction (BD+C) 32% MINERGIE – MINERGIE 4.9% LEED – Interior Design and Construction (ID+C) 5% MINERGIE – MINERGIE 4.6% Healthcare Total 1.1% Total 3.2% Total 1.7% LEED – Building Design and Construction (BD+C) 54.4% BREEAM – New Construction 33.6% LEED – Building Design and Construction (BD+C) 31.7% LEED – for Homes 25.6% NF HQE – Bâtiments Tertiaires – Neuf ou Rénovation 27.9% BREEAM – New Construction 18.3% LEED – Interior Design and Construction (ID+C) 20% GPR Gebouw – GPR Gebouw – Design & Construction 17.8% NF HQE – Bâtiments Tertiaires – Neuf ou Rénovation 15.2% LEED – Building Design and Construction (BD+C) 12.7% LEED – for Homes 11.7% MINERGIE – MINERGIE 4.2% GPR Gebouw – GPR Gebouw – Design & Construction 9.7% Hotel Total 6.3% Total 7.4% Total 7.8% Total 6.9% Florida Green Building Certification – Design & Construction 52.5% EDGE – Excellence in Design for Greater Efficiencies 21% BREEAM – New Construction 51.9% LEED – Building Design and Construction (BD+C) 20.6% LEED – Building Design and Construction (BD+C) 39.6% BCA Green Mark – New Buildings 17.5% DGNB – New Construction 11.9% BREEAM – New Construction 19.6% EDGE – Excellence in Design for Greater Efficiencies 7.8% LEED – Building Design and Construction (BD+C) 16.4% LEED – Building Design and Construction (BD+C) 8.5% Florida Green Building Certification – Design & Construction 16.1% IGBC Green – New Building 15.7% LEED – Interior Design and Construction (ID+C) 5.2% EDGE – Excellence in Design for Greater Efficiencies 9% China Green Building Label – GB/T 50378-2014 – Design & Construction 10.5% BCA Green Mark – New Buildings 5.5% Industrial Total 0.9% Total 7.1% Total 24.4% Total 16% Total 8.3% Total 11.9% Green Star SA – Design & As Built 76% LEED – Building Design and Construction (BD+C) 90.2% CASBEE – New Construction 54.6% BREEAM – New Construction 60.2% Green Star – Design & As Built 97.6% LEED – Building Design and Construction (BD+C) 35.3% Green Star – Design & As Built 24% LEED – Interior Design and Construction (ID+C) 5.5% LEED – Building Design and Construction (BD+C) 28.2% DGNB – New Construction 24.5% Green Star – Interiors 2.4% BREEAM – New Construction 26.1% CALGreen – CALGreen 3.4% China Green Building Label – GB/T 50378-2014 – Design & Construction 10.4% LEED – Building Design and Construction (BD+C) 4.6% CASBEE – New Construction 13.3% WELL Building Standard – New Buildings 0.2% BCA Green Mark – New Buildings 2.3% NF HQE – Bâtiments Tertiaires – Neuf ou Rénovation 2.8% DGNB – New Construction 10.6% BEAM Plus – New Building 1.7% BERDE – New Construction 1.9% Green Star – Design & As Built 2.8% Lodging, Leisure & Recreation Total 0.8% Total 5.2% Total 2.3% Total 2.8% LEED – Interior Design and Construction (ID+C) 100% BEAM Plus – New Building 100% MINERGIE – MINERGIE 41.9% BEAM Plus – New Building 34% BREEAM – New Construction 37.3% MINERGIE – MINERGIE 27.5% LEED – Building Design and Construction (BD+C) 3.9% BREEAM – New Construction 24.5% LEED – Building Design and Construction (BD+C) 2.5% Mixed use Total 23.8% Total 36.8% Total 8.6% Total 3.2% Total 22% LEED – Building Design and Construction (BD+C) 57.1% LEED – Building Design and Construction (BD+C) 64.5% MINERGIE – MINERGIE 33.6% Green Star – Design & As Built 100% LEED – Building Design and Construction (BD+C) 56.3% LEED – Interior Design and Construction (ID+C) 31.3% China Green Building Label – GB/T 50378-2014 – Design & Construction 13.4% BREEAM – New Construction 20.5% China Green Building Label – GB/T 50378-2014 – Design & Construction 9.1% LEED – Neighborhood Development (ND) 4.6% BEAM Plus – New Building 7.5% LEED – Building Design and Construction (BD+C) 20% LEED – Interior Design and Construction (ID+C) 6.4% NGBS – National Green Building Standard – Design & Construction 4% BCA Green Mark – New Buildings 7.1% DGNB – New Construction 9.4% MINERGIE – MINERGIE 5.2% Florida Green Building Certification – Design & Construction 3% LEED – Neighborhood Development (ND) 3.6% Miljöbyggnad – New Buildings 4.7% BEAM Plus – New Building 5.1% Office Total 12.2% Total 15.3% Total 10% Total 20.9% Total 31.7% Total 16.9% Green Star SA – Design & As Built 77.9% LEED – Building Design and Construction (BD+C) 66% LEED – Building Design and Construction (BD+C) 36.5% BREEAM – New Construction 43.7% Green Star – Design & As Built 75% LEED – Building Design and Construction (BD+C) 40.6% Green Star – Design & As Built 19.4% LEED – Interior Design and Construction (ID+C) 32.1% CASBEE – New Construction 18.4% LEED – Building Design and Construction (BD+C) 16.3% Green Star – Interiors 7.7% LEED – Interior Design and Construction (ID+C) 17.3% Green Star – Interiors 2.7% WELL Building Standard – Core and Shell 0.7% BCA Green Mark – New Buildings 10.8% NF HQE – Bâtiments Tertiaires – Neuf ou Rénovation 14.8% WELL Building Standard – Core and Shell 7.6% BREEAM – New Construction 12.4% WELL Building Standard – New Interiors 0.5% LEED – Interior Design and Construction (ID+C) 9.7% BREEAM – Refurbishment and Fit-out 7.5% Green Star – Communities 7.2% Green Star – Design & As Built 10.1% Fitwel – Fitwel – Design & Construction 0.3% ABINC Certification – Urban Development and Shopping Centre 8% MINERGIE – MINERGIE 5.1% Green Star NZ – Design & As Built 1.2% NF HQE – Bâtiments Tertiaires – Neuf ou Rénovation 4.2% Other Total 0.4% Total 4.3% Total 3.1% Total 0.7% LEED – Building Design and Construction (BD+C) 93.3% BCA Green Mark – New Buildings 60.7% BREEAM – New Construction 64.7% LEED – Building Design and Construction (BD+C) 38.3% Green Globes – Sustainable Interiors 5.7% China Green Building Label – GB/T 50378-2014 – Design & Construction 39.3% MINERGIE – MINERGIE 20.6% BREEAM – New Construction 28.6% LEED – Interior Design and Construction (ID+C) 1% Miljöbyggnad – New Buildings 2.7% MINERGIE – MINERGIE 9.1% MINERGIE – P 2.7% BCA Green Mark – New Buildings 9% MINERGIE – ECO 2.7% China Green Building Label – GB/T 50378-2014 – Design & Construction 5.8% Residential Total 11.2% Total 17.5% Total 7.4% Total 1.7% Total 10.5% LEED – Building Design and Construction (BD+C) 52% IGBC Green – Homes 72.6% MINERGIE – MINERGIE 31.3% Green Star – Design & As Built 100% LEED – Building Design and Construction (BD+C) 35.6% LEED – for Homes 17.6% Housing Performance Indication System – Housing Performance Evaluation – Design & Construction 15% BREEAM – New Construction 27.6% LEED – for Homes 12% NGBS – National Green Building Standard – Design & Construction 15.2% CASBEE – New Construction 11.3% In-house scheme – Greenproperty – Design & Construction 15.1% NGBS – National Green Building Standard – Design & Construction 10.4% Build it Green – GreenPoint Rated, New Home 4.6% BCA Green Mark – New Buildings 0.4% BREEAM – Code for Sustainable Homes 8.6% IGBC Green – Homes 7.9% LEED – Interior Design and Construction (ID+C) 1.7% BEAM Plus – New Building 0.3% GPR Gebouw – GPR Gebouw – Design & Construction 4.3% MINERGIE – MINERGIE 6.4% Retail Total 4.3% Total 4.5% Total 14.6% Total 9.2% Total 7.9% Total 7.7% LEED – Building Design and Construction (BD+C) 100% LEED – Building Design and Construction (BD+C) 73.3% CASBEE – New Construction 28.8% BREEAM – New Construction 81.2% Green Star – Design & As Built 97.9% LEED – Building Design and Construction (BD+C) 29.8% LEED – Interior Design and Construction (ID+C) 20.1% BCA Green Mark – New Buildings 24.2% LEED – Building Design and Construction (BD+C) 4.7% Green Star – Interiors 2.1% BREEAM – New Construction 26.5% LEED – Neighborhood Development (ND) 4.5% LEED – Building Design and Construction (BD+C) 24% DGNB – New Construction 4.1% CASBEE – New Construction 8.9% BERDE – Retrofits and Renovations 1.5% ABINC Certification – Urban Development and Shopping Centre 15.1% NF HQE – Bâtiments Tertiaires – Neuf ou Rénovation 3.3% Green Star – Design & As Built 8.1% LEED – for Homes 0.4% China Green Building Label – GB/T 50378-2014 – Design & Construction 4.2% BREEAM – Refurbishment and Fit-out 2.5% BCA Green Mark – New Buildings 7.5% Technology/Science Total 27.3% Total 3.4% Total 12.4% Total 14.7% Total 24.6% LEED – Building Design and Construction (BD+C) 64.1% BCA Green Mark – New Buildings 100% BREEAM – New Construction 100% LEED – Interior Design and Construction (ID+C) 100% LEED – Building Design and Construction (BD+C) 60.9% LEED – Interior Design and Construction (ID+C) 33.8% LEED – Interior Design and Construction (ID+C) 32.6% WELL Building Standard – Core and Shell 1.4% BREEAM – New Construction 3.9% Fitwel – Fitwel – Design & Construction 0.7% WELL Building Standard – Core and Shell 1.3% Fitwel – Fitwel – Design & Construction 0.7% Overall Total 4.4% Total 8.9% Total 18.3% Total 13% Total 14.4% Total 11.4% Green Star SA – Design & As Built 53.4% LEED – Building Design and Construction (BD+C) 68% LEED – Building Design and Construction (BD+C) 32.5% BREEAM – New Construction 53.8% Green Star – Design & As Built 82.2% LEED – Building Design and Construction (BD+C) 37.7% LEED – Building Design and Construction (BD+C) 31.3% LEED – Interior Design and Construction (ID+C) 17.5% CASBEE – New Construction 30.6% DGNB – New Construction 12% Green Star – Interiors 5.9% BREEAM – New Construction 17% Green Star – Design & As Built 13.7% LEED – for Homes 4.5% BCA Green Mark – New Buildings 8.8% LEED – Building Design and Construction (BD+C) 8% WELL Building Standard – Core and Shell 5.1% LEED – Interior Design and Construction (ID+C) 7.9% Green Star – Interiors 1.6% NGBS – National Green Building Standard – Design & Construction 3.9% China Green Building Label – GB/T 50378-2014 – Design & Construction 7.8% NF HQE – Bâtiments Tertiaires – Neuf ou Rénovation 6.2% Green Star – Communities 4.9% CASBEE – New Construction 6% CALGreen – CALGreen 1.2% IGBC Green – Homes 6.1% MINERGIE – MINERGIE 6% Green Star NZ – Design & As Built 0.8% Green Star – Design & As Built 5.1% -
After last year’s increase in like-for-like energy consumption, this year we observe a global reduction of 2%. This decrease can be seen across all regions, with Europe having the largest reduction of 3.2%. Global GHG emissions and water consumption also fell by 3% and 1.5%, respectively.

-
In 2020, GRESB introduced indicators on embodied carbon in 2020 in the Development Component. The graph shows how many development entities assess life cycle emissions for their development projects.
31% of European development entities assess embodied carbon whereas only 8% of entities from the Americas. 42% of Oceanian participants have assessed development projects.
Assessing embodied carbon is critical to achieving the overall goal of net zero.
How to measure, quantify, and standardize reporting of embodied carbon is an important new frontier for the industry.

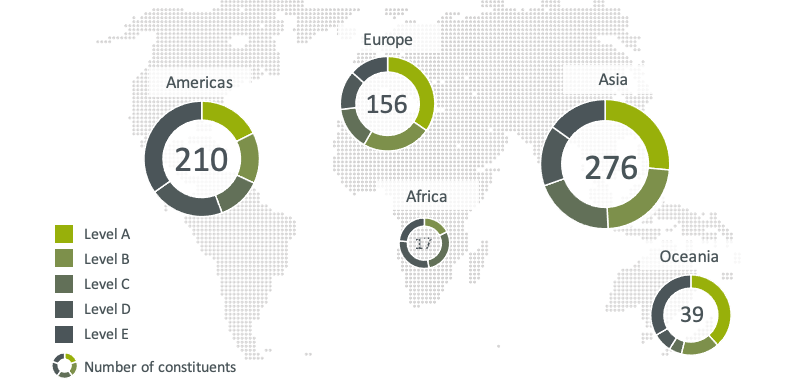
2020 is the fourth year GRESB has evaluated the ESG transparency levels of listed companies and REITs through GRESB Public Disclosure
The scope of the analysis includes listed companies in developed and emerging markets and is available to GRESB Investor Members subscribed to listed real estate data. See 2020 Public Disclosure Universe.
GRESB Public Disclosure consists of 22 indicators that contribute to a 70 point maximum. Constituents are assigned a GRESB Public Disclosure Level from A to E based on the points received. The 2020 guidance and scoring methodology is available here.
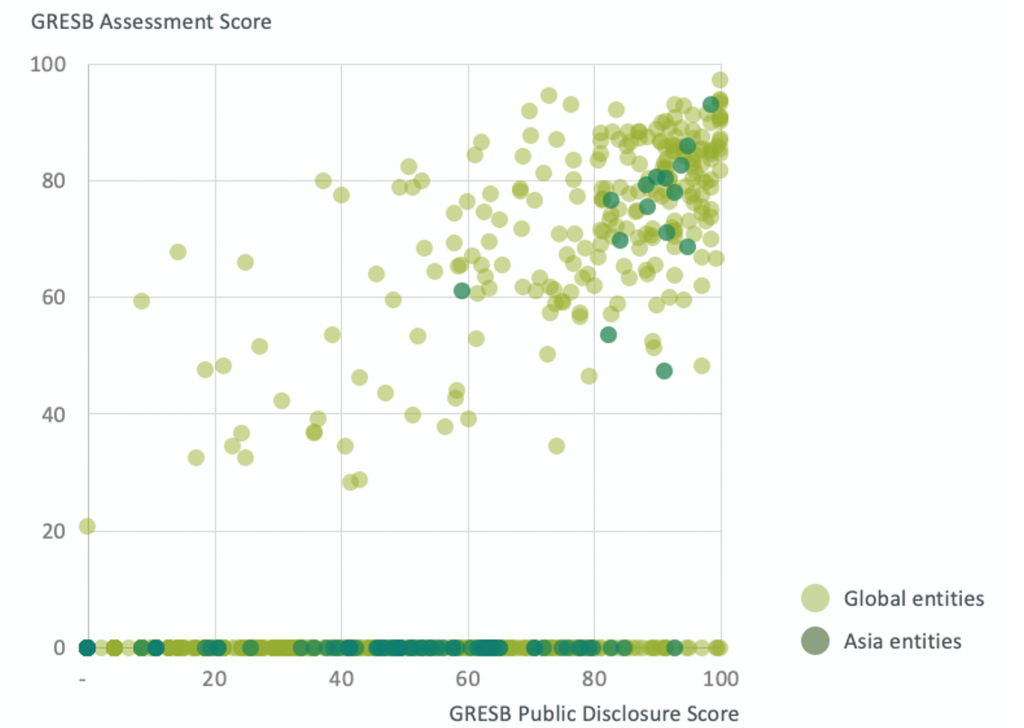
Transparency levels in the Public Disclosure dataset correlate with ESG performance measured by the GRESB Real Estate Assessment
271 REITs and property companies participated in the GRESB Assessment this year, demonstrating their commitment to ESG transparency to investors.
We observe a positive correlation between transparency levels measured by the Public Disclosure dataset and ESG performance measured by the GRESB Real Estate Assessment (a global coefficient of 0.65).
Resilience
-
97%, 93%, and 82% of 2020 Resilience Module Participants (Real Estate, Infrastructure Fund, and Infrastructure Asset, respectively) had assigned responsibility for climate risk and resilience of the entity to an employee and/or team.
The breakdown of where that responsibility lies within the organization, particularly between the “same individual” (green) and “different individual” (light blue), suggests that, in many cases, climate risk and resilience are deemed as a sustainability issue as opposed to their own risk management issues.
While a relatively high percentage of 2020 Resilience Module Participants reported that their organization has a systematic process for communication and review of resilience-related information by the most senior governance body with responsibility for the entity (92% Real Estate, 74% Infrastructure Asset, 79% Infrastructure Fund), the resilience issues that were communicated varied. Of those aggregated participants reporting the existence of such processes, 91% reported periodically about transition risks, 97% about physical risks, and 73% about social risks, illustrating that physical risks are a top priority with regards to communication and review by top management.

-
GRESB 2020 Resilience Module Participants reported systematic processes to assess their entities’ exposure to physical risk more often than for transition or social risk. Additionally, Real Estate Participants more often had systematic risk assessment processes in place than did Infrastructure Participants.

-
Of the 2020 Resilience Module participants, 85%, 75%, and 58% (Real Estate, Infrastructure Fund, and Infrastructure Asset, respectively) reported having a systematic process to incorporate climate risk and resilience into planning, budgeting, evaluation, and/or similar activities.
Real Estate participants demonstrated higher rates of integration across risk type and integration method as opposed to Infrastructure participants. Across integration method, well-defined climate-related risks are generally easier to incorporate than, often times less-quantifiable, social risks. Finally, work plans seemed to be the most systematically leveraged integration method of resilience issues.

Real Estate 2020 Resilience Module participants tended to have implemented resilience-related business strategies with regard to their entities at a greater rate than did Infrastructure Fund participants, than did Infrastructure Asset participants. While standing investments tended to be the target across participant types, this could also reflect the composition of the participating entities.
New construction project strategies included minimum design standards for energy efficiency, energy demand management, certification standards, integration of renewable energy, climate sensitivity assessments, and use of low-embodied carbon materials. Standing investment strategies included CRREM scenario analysis, physical climate risk analysis, implementation of operational green building certifications, and evaluation of on-site renewable energy opportunities. New acquisition strategies included much of the same. In general, there was significant overlap between efforts across each investment type.

-
Some examples of social risks captured by the 2020 Resilience Module include: crime rate, modern slavery, workplace health and safety, pandemics, physical security, cyber security, terrorism, demographic shifts, and even “social media risk”. The range of such responses highlights the difficulty of providing useful standardized and benchmarked data to asset managers and investors.
Other answers were drawn directly from the language of the TCFD, such as increased stakeholder concern or negative stakeholder feedback, or addressed environmental or governance issues such as air quality or site contamination. This further illuminates the fact that risks relating to social, climate-related, and other ESG-related issues are not mutually exclusive, and can often complement or compound each other.
Whether stemming from or ultimately affecting people, all ESG risks are related to humans in one manner or another, making the delineation of social risk in the context of a resilience assessment a formidable challenge.
Americas
-

2020 Real Estate Assessment Results -

2020 Real Estate Assessment Results -

2020 Real Estate Assessment Results
Asia
-

2020 Real Estate Assessment Results -

2020 Real Estate Assessment Results -

2020 Real Estate Assessment Results
EMEA
-

2020 Real Estate Assessment Results -

2020 Real Estate Assessment Results -

Oceania
-

-

2020 Real Estate Assessment Results